

At the time of writing (Tuesday), BTC, XRP and LINK are breaking down across the board. These aren’t “could be” trades. They’re live setups confirmed by structure, bias, and level rejection — and we’re in.
This is not a recap. It’s a breakdown of what we saw, what the Framework confirmed, and why we shorted. Each setup follows the same logic, visible whether you’re on the 5m or the 4H — bias, context, confirmation.
🔻 BTCUSD – Monthly High Rejected, Structure Failing
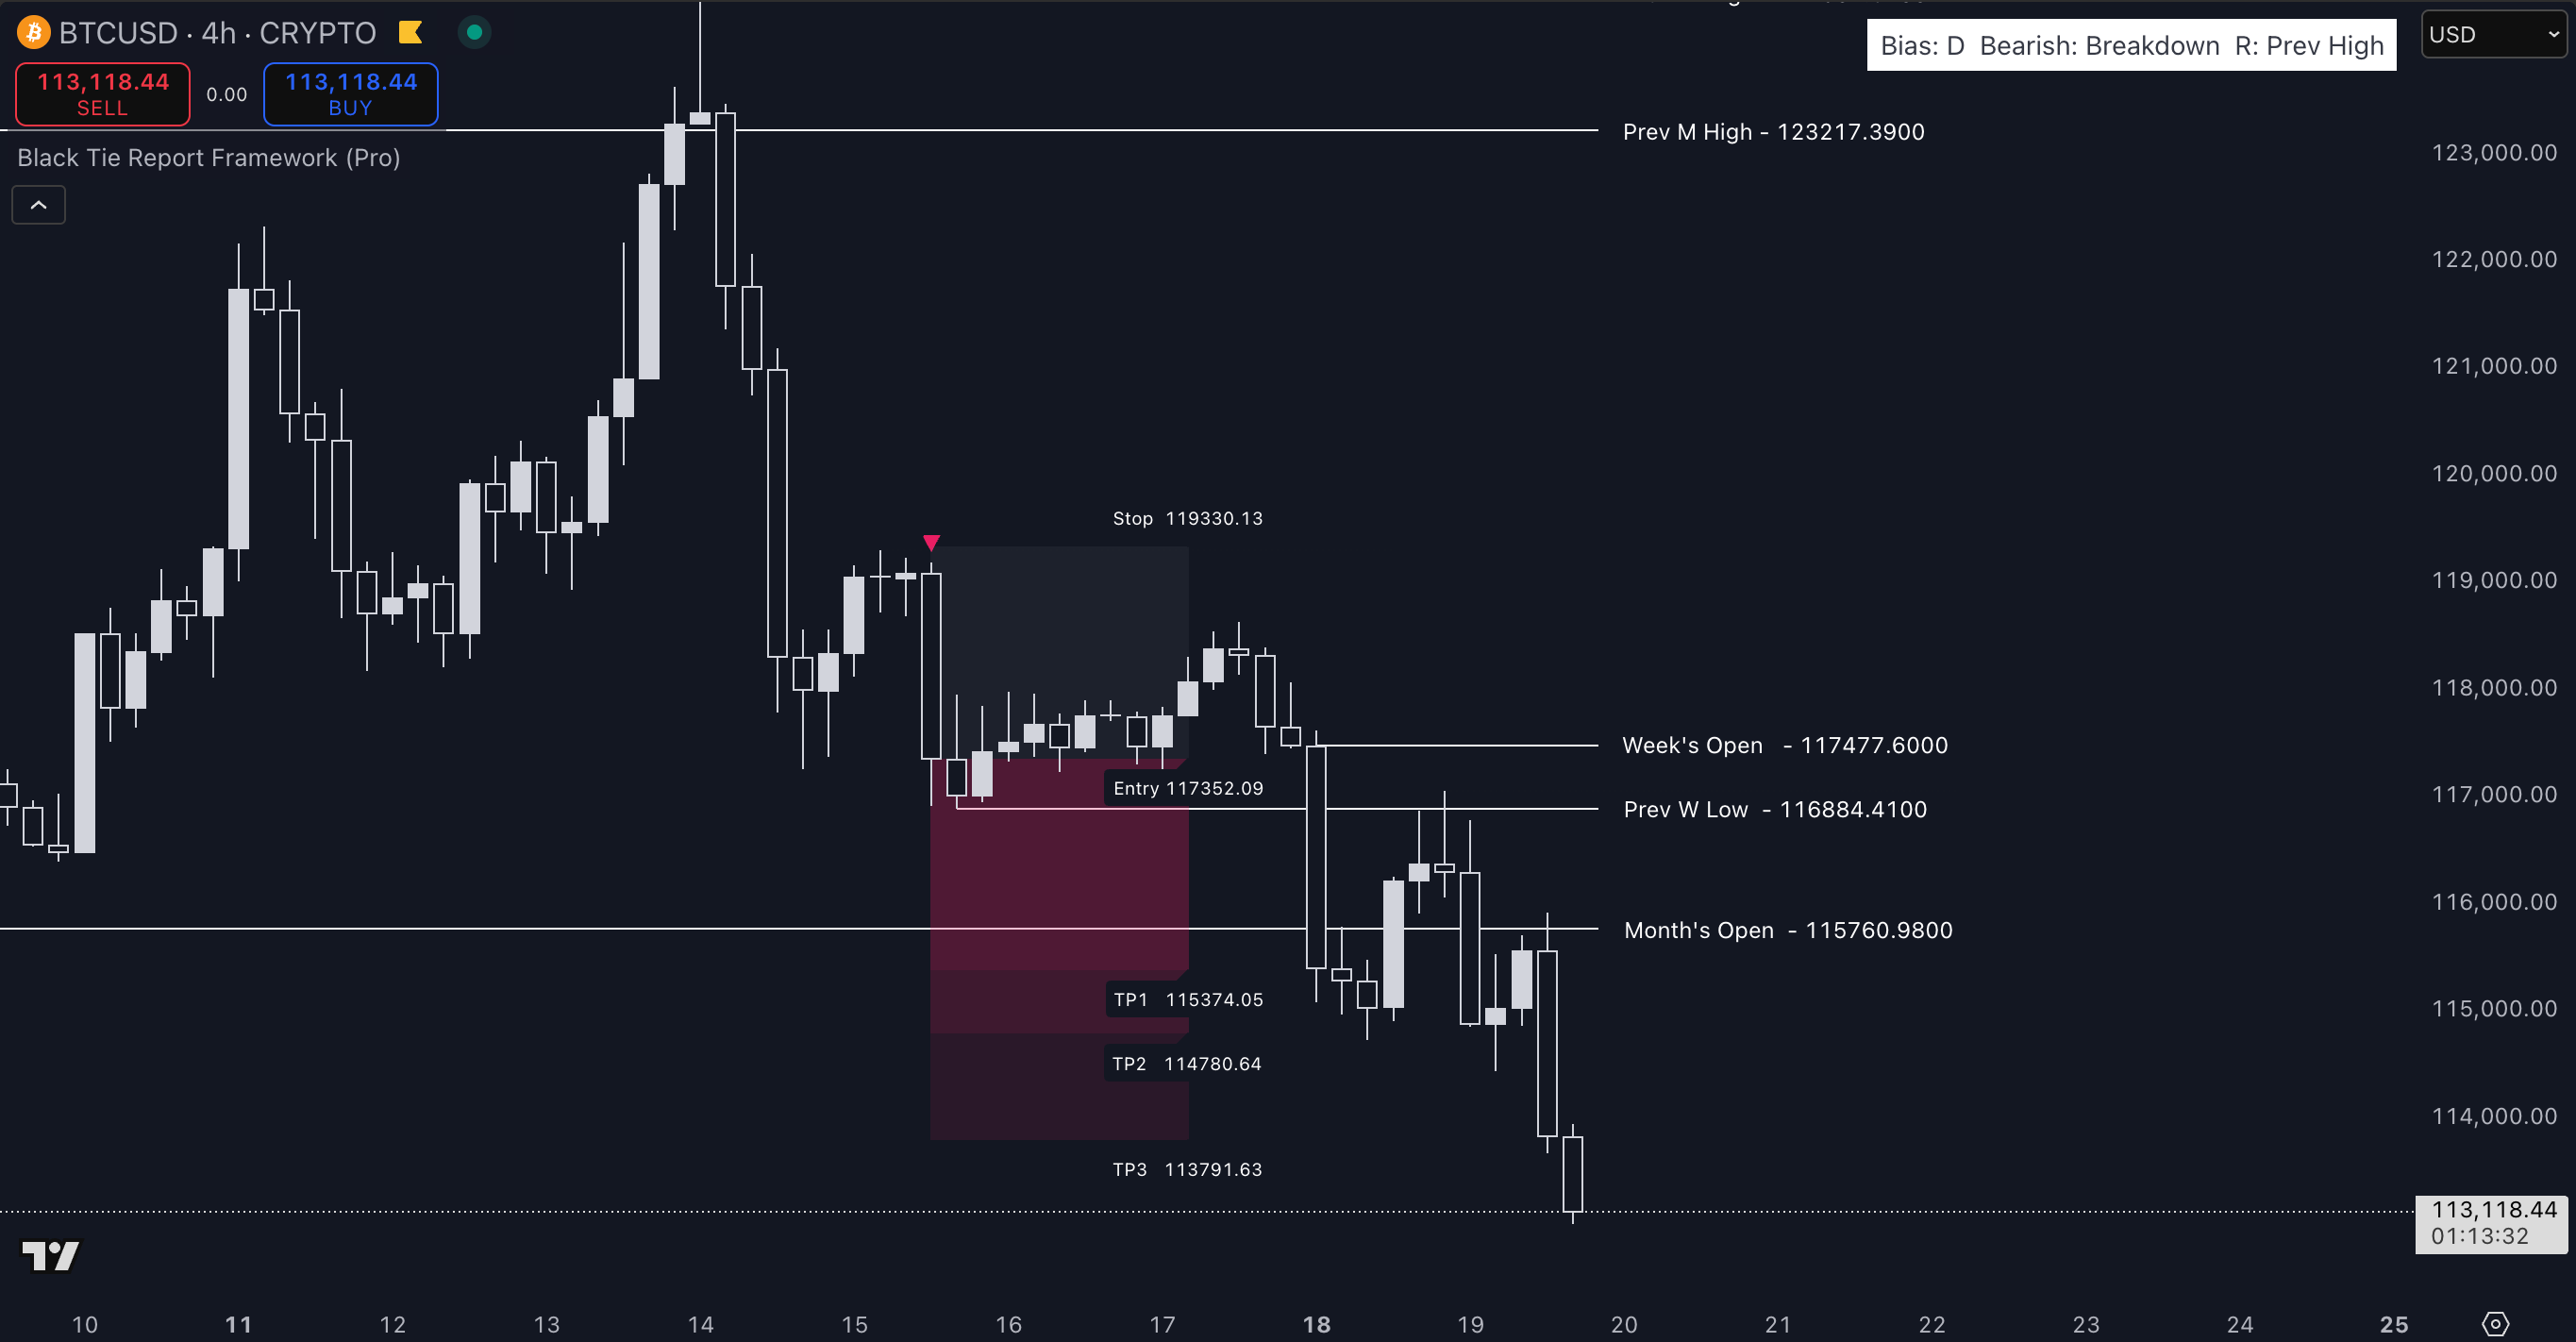
Chart time frame: 4H
Bias: Bearish Breakdown
Entry: 117,352
Stop: 119,330
TPs: 115,374 → 114,780 → 113,791
🧠 Analysis
BTC attempted to break through the Previous Month’s High (123,217) last week but was aggressively rejected. What followed was key:
The first lower high printed right below 120K
Then a clear BOS/CHoCH on the 4H timeframe
The indicator switched to Bearish Breakdown and auto-drew a short box just above 117K
We shorted into that retrace because it aligned with:
Weekly Open rejection
Compression beneath key levels
Breakdown retest with no strength on the bounce
Now price is moving toward TP3 as we write this. There’s no need to predict — the bias, structure, and box were all clearly defined.
🔻 XRPUSDT – Weak Bounce, Trap Confirmed
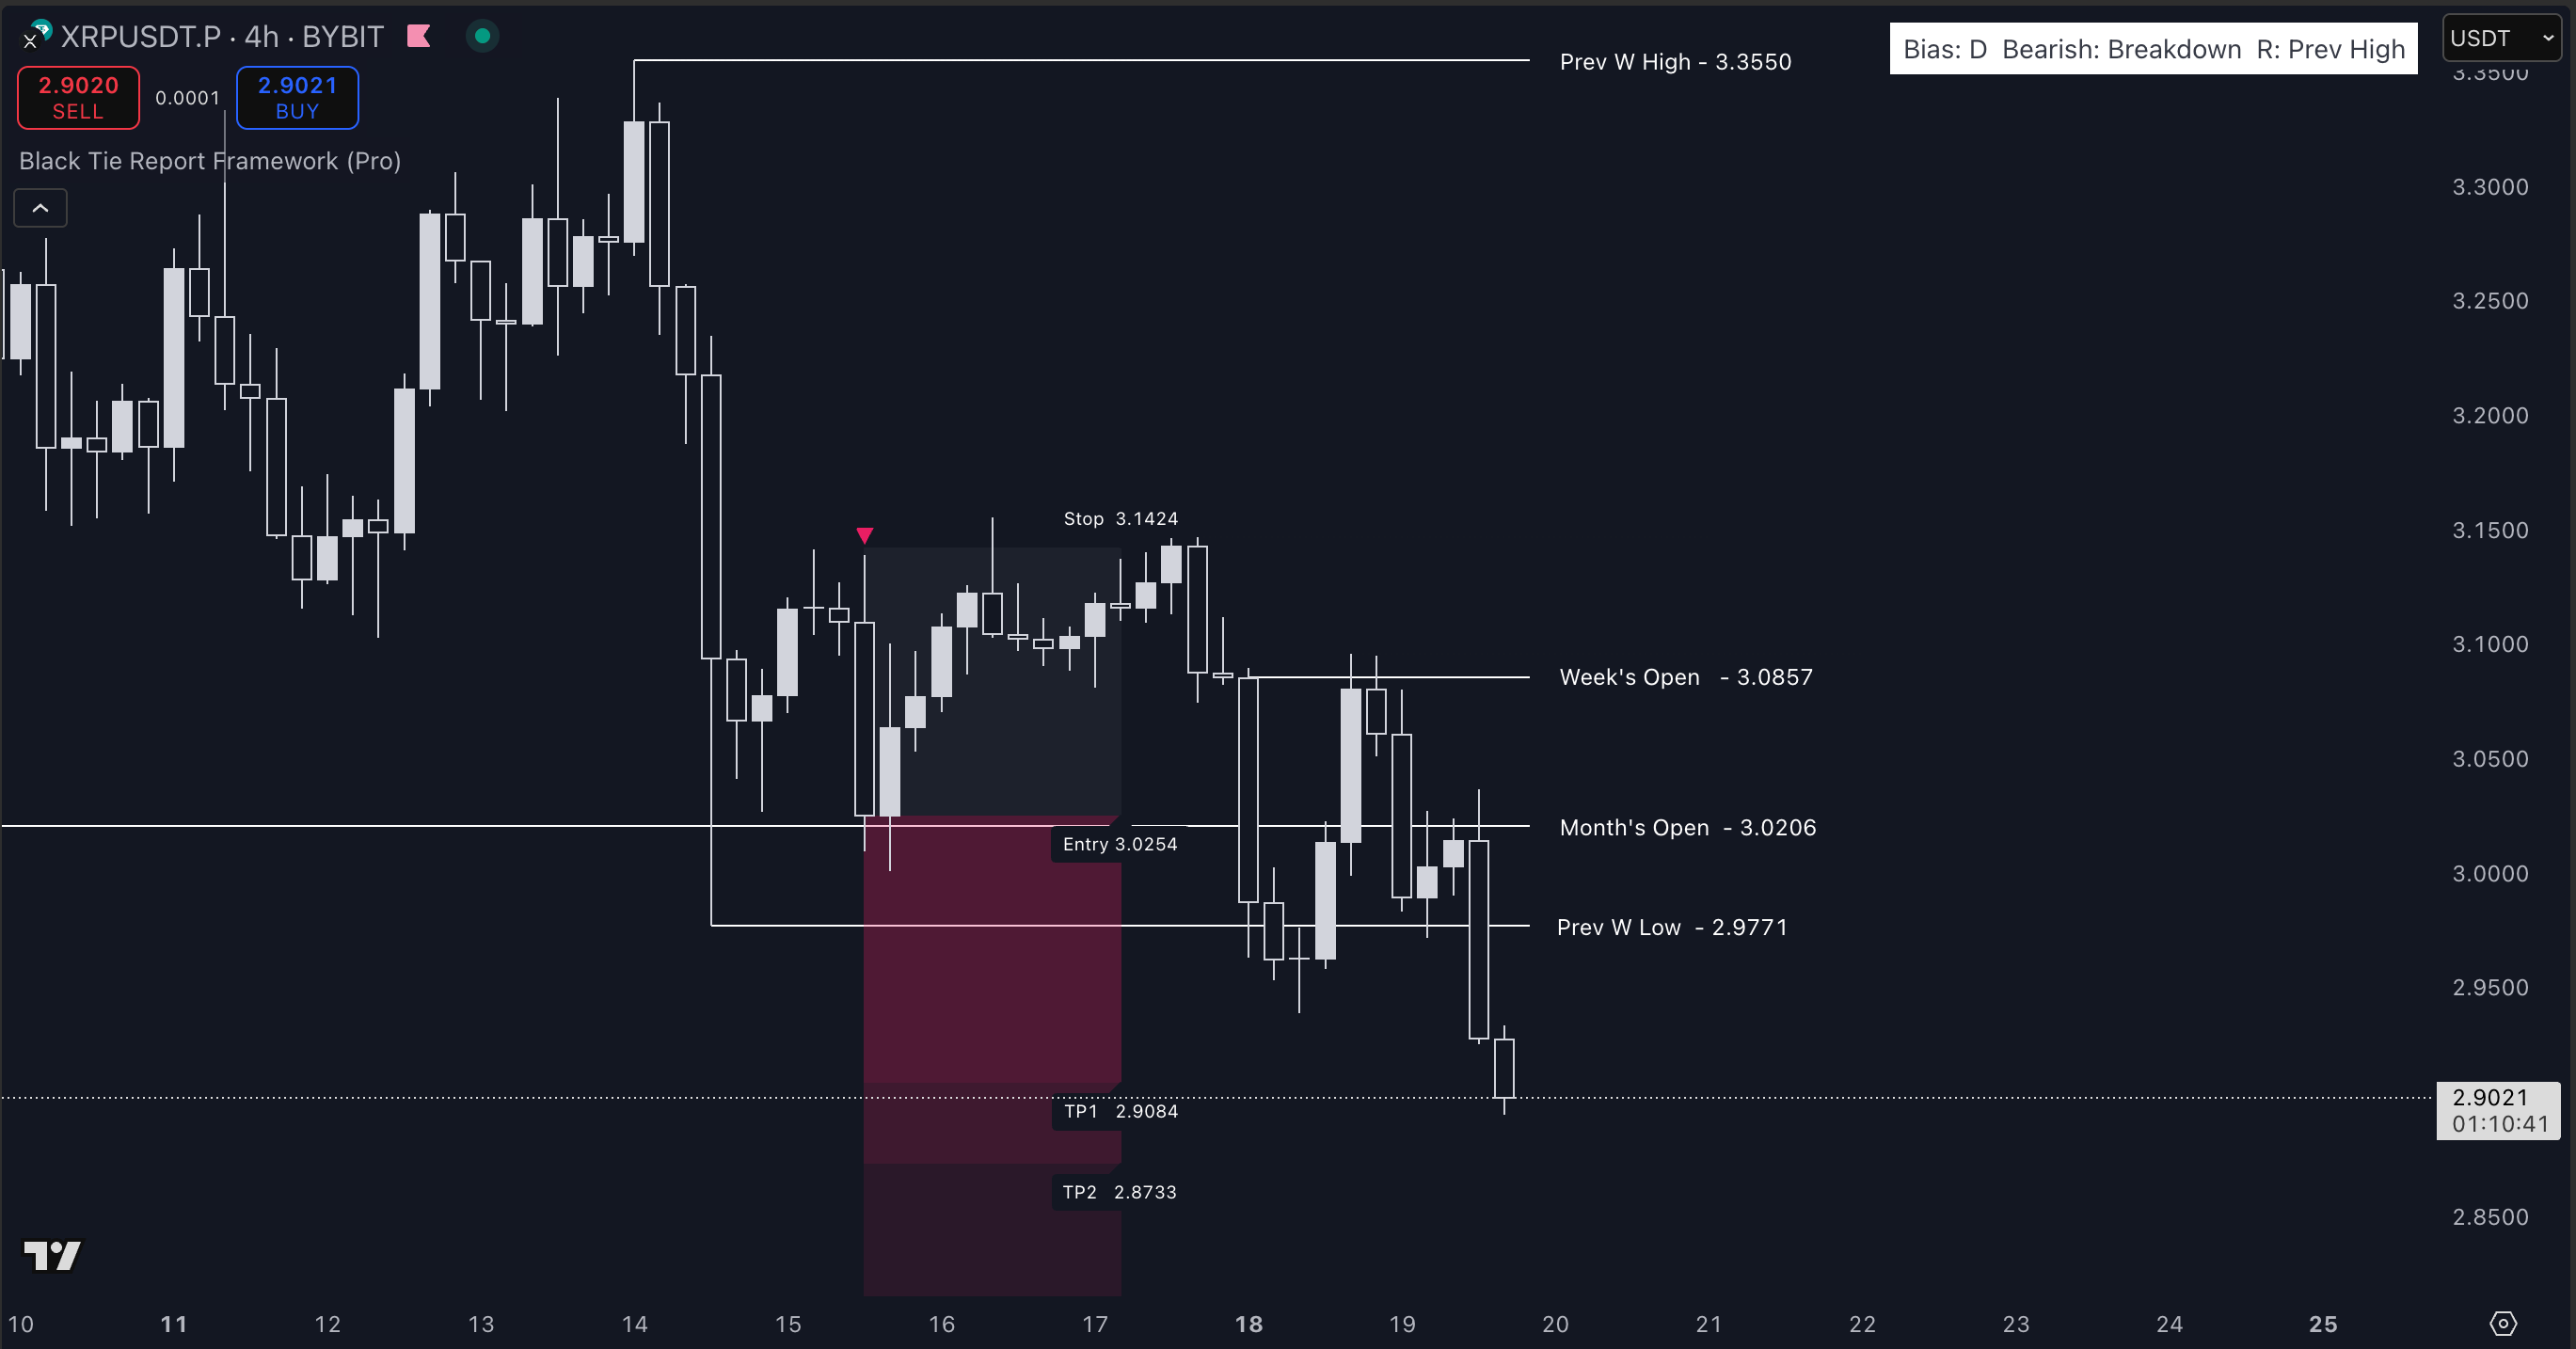
Chart time frame: 4H
Bias: Bearish Breakdown
Entry: 3.025
Stop: 3.142
TPs: 2.908 → 2.873
🧠 Analysis
XRP looked like it might recover early in the week — it tapped above the Weekly Open (3.085) and started to consolidate.
But context mattered:
Price failed to hold above the Monthly Open (3.020)
Buyers were stuck under resistance for 24+ hours
Structure broke down again on the 4H and bias flipped to Bearish Breakdown
The short box formed between 3.02–3.04. It was a classic case of late longs getting trapped on weak momentum.
We entered on the retest — and now price is breaking below the Prev Weekly Low (2.977) live.
This is the kind of setup that often appears on the 15m or 5m as compression + breakdown. On 4H, it just gives you more room to breathe.
🔻 LINKUSDT – Stacked Resistance Rejection
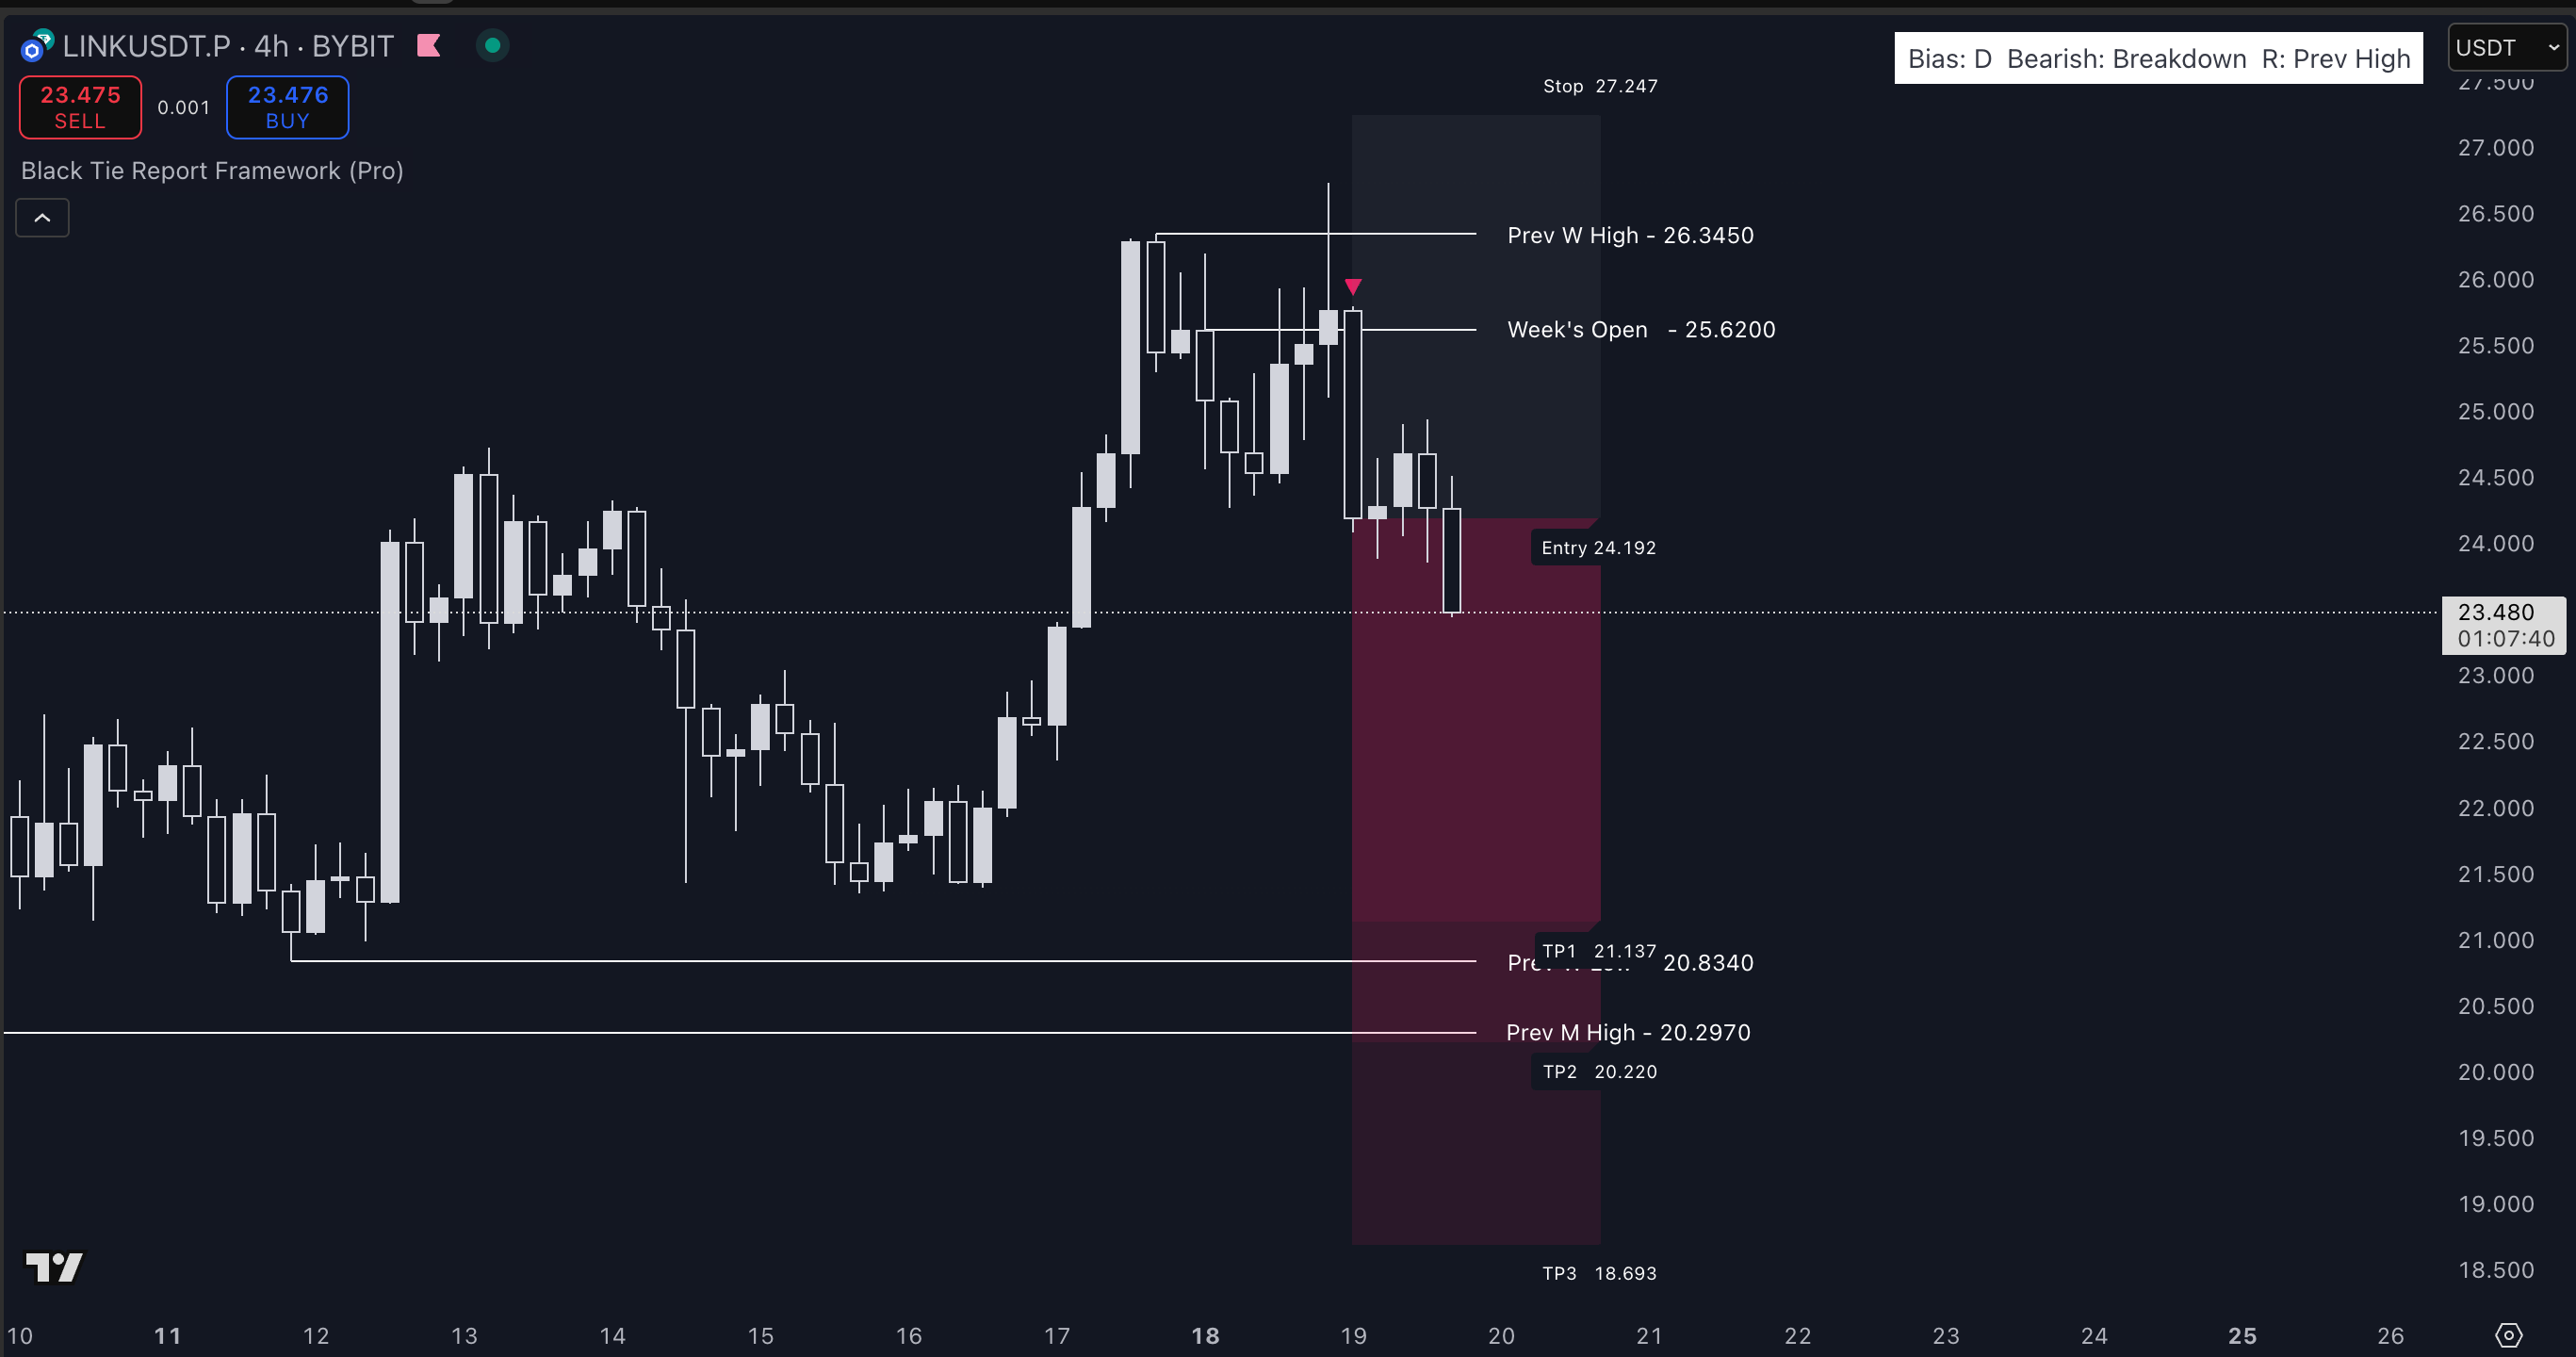
Chart time frame: 4H
Bias: Bearish Breakdown
Entry: 24.192
Stop: 27.247
TPs: 21.137 → 20.220 → 18.693 (in progress)
🧠 Analysis
LINK was cleanest of all three:
Price pushed into a triple confluence zone:
– Prev Week’s High (26.345)
– Weekly Open (25.62)
– Unfilled inefficiency from prior breakoutInstead of continuation, we got a failed breakout and then a breakdown in structure.
The Framework marked it with:
Bearish bias
A clear short box at 24.1–25.0
Target zones aligned with previous support + Month’s High
We shorted the pullback and are now seeing fast movement toward TP2 and TP3.
The breakdown is accelerating as you read this, and it’s a perfect example of how bias + rejection + retest = trade.
What These Three Have in Common
✅ Bearish Bias Confirmed
✅ Rejection from HTF Level
✅ Market Structure Change preceded Entry
✅ Short box retested
✅ Breakdown in progress
These are not predictions. The structure already broke. The bias already shifted. The entries were all reactive, not anticipatory.
And if you zoom into lower timeframes — 15m, 5m — you’ll find the same conditions there too. You just have to move quicker.
The Framework works the same across all timeframes because the logic is the same:
Follow structure
Respect context
Don’t counter bias
When traders say “don’t guess, just follow the market” — this is what they mean.
You don’t need:
100 indicators
Oscillators
Prediction models
You need bias, context, and a clear entry zone.
That’s what the Black Tie Report Framework gives you. Whether you’re scalping on 5m or swinging on 4H — it’s the same formula.
Access the Framework
You get:
Automatic bias detection
CHoCH/BOS labels
Dynamic short/long zones
Weekly and Monthly levels
Presets for 5m → 1D
Webhook-ready alerts
Private Discord access
Only 2 spots left at $47/month before the price increases to $79.
Don’t forget to follow the latest updates and real-time trade ideas on X/Twitter:
Stay sharp.