

If you're serious about trading, you can't rely on gut feeling. You need data. You need structure. You need proof.
That's exactly what the new Backtest Panel in the Black Tie Report Framework delivers: a built-in performance module that helps you validate trades, analyze profitability, and understand how the Framework behaves across different assets, timeframes, and settings.
In this article, you'll learn:
What the Backtest Panel is
How to use it across different assets and timeframes
How to read its results
What examples look like on BTC, XAUUSD, EURUSD, USDJPY, NAS100, SOL, and DOGE
We'll also include all relevant screenshots so you can see how it's applied in real trading environments.
🔢 What is the Backtest Panel?
The Backtest Panel is a new module embedded into the Framework. It automatically logs the trades that meet all Framework conditions and provides:
Win rate (with confidence interval)
Expectancy per trade (in R)
Risk per trade and leverage
Total P&L and net %
Verdict: Profitable? YES/NO
It runs locally on your chart, not through a Pine Script strategy tester. That means you get backtested insight directly from your settings and visual trades, not some abstracted model disconnected from the real use of the indicator.
This is not a gimmick. It’s practical, testable and fully transparent.
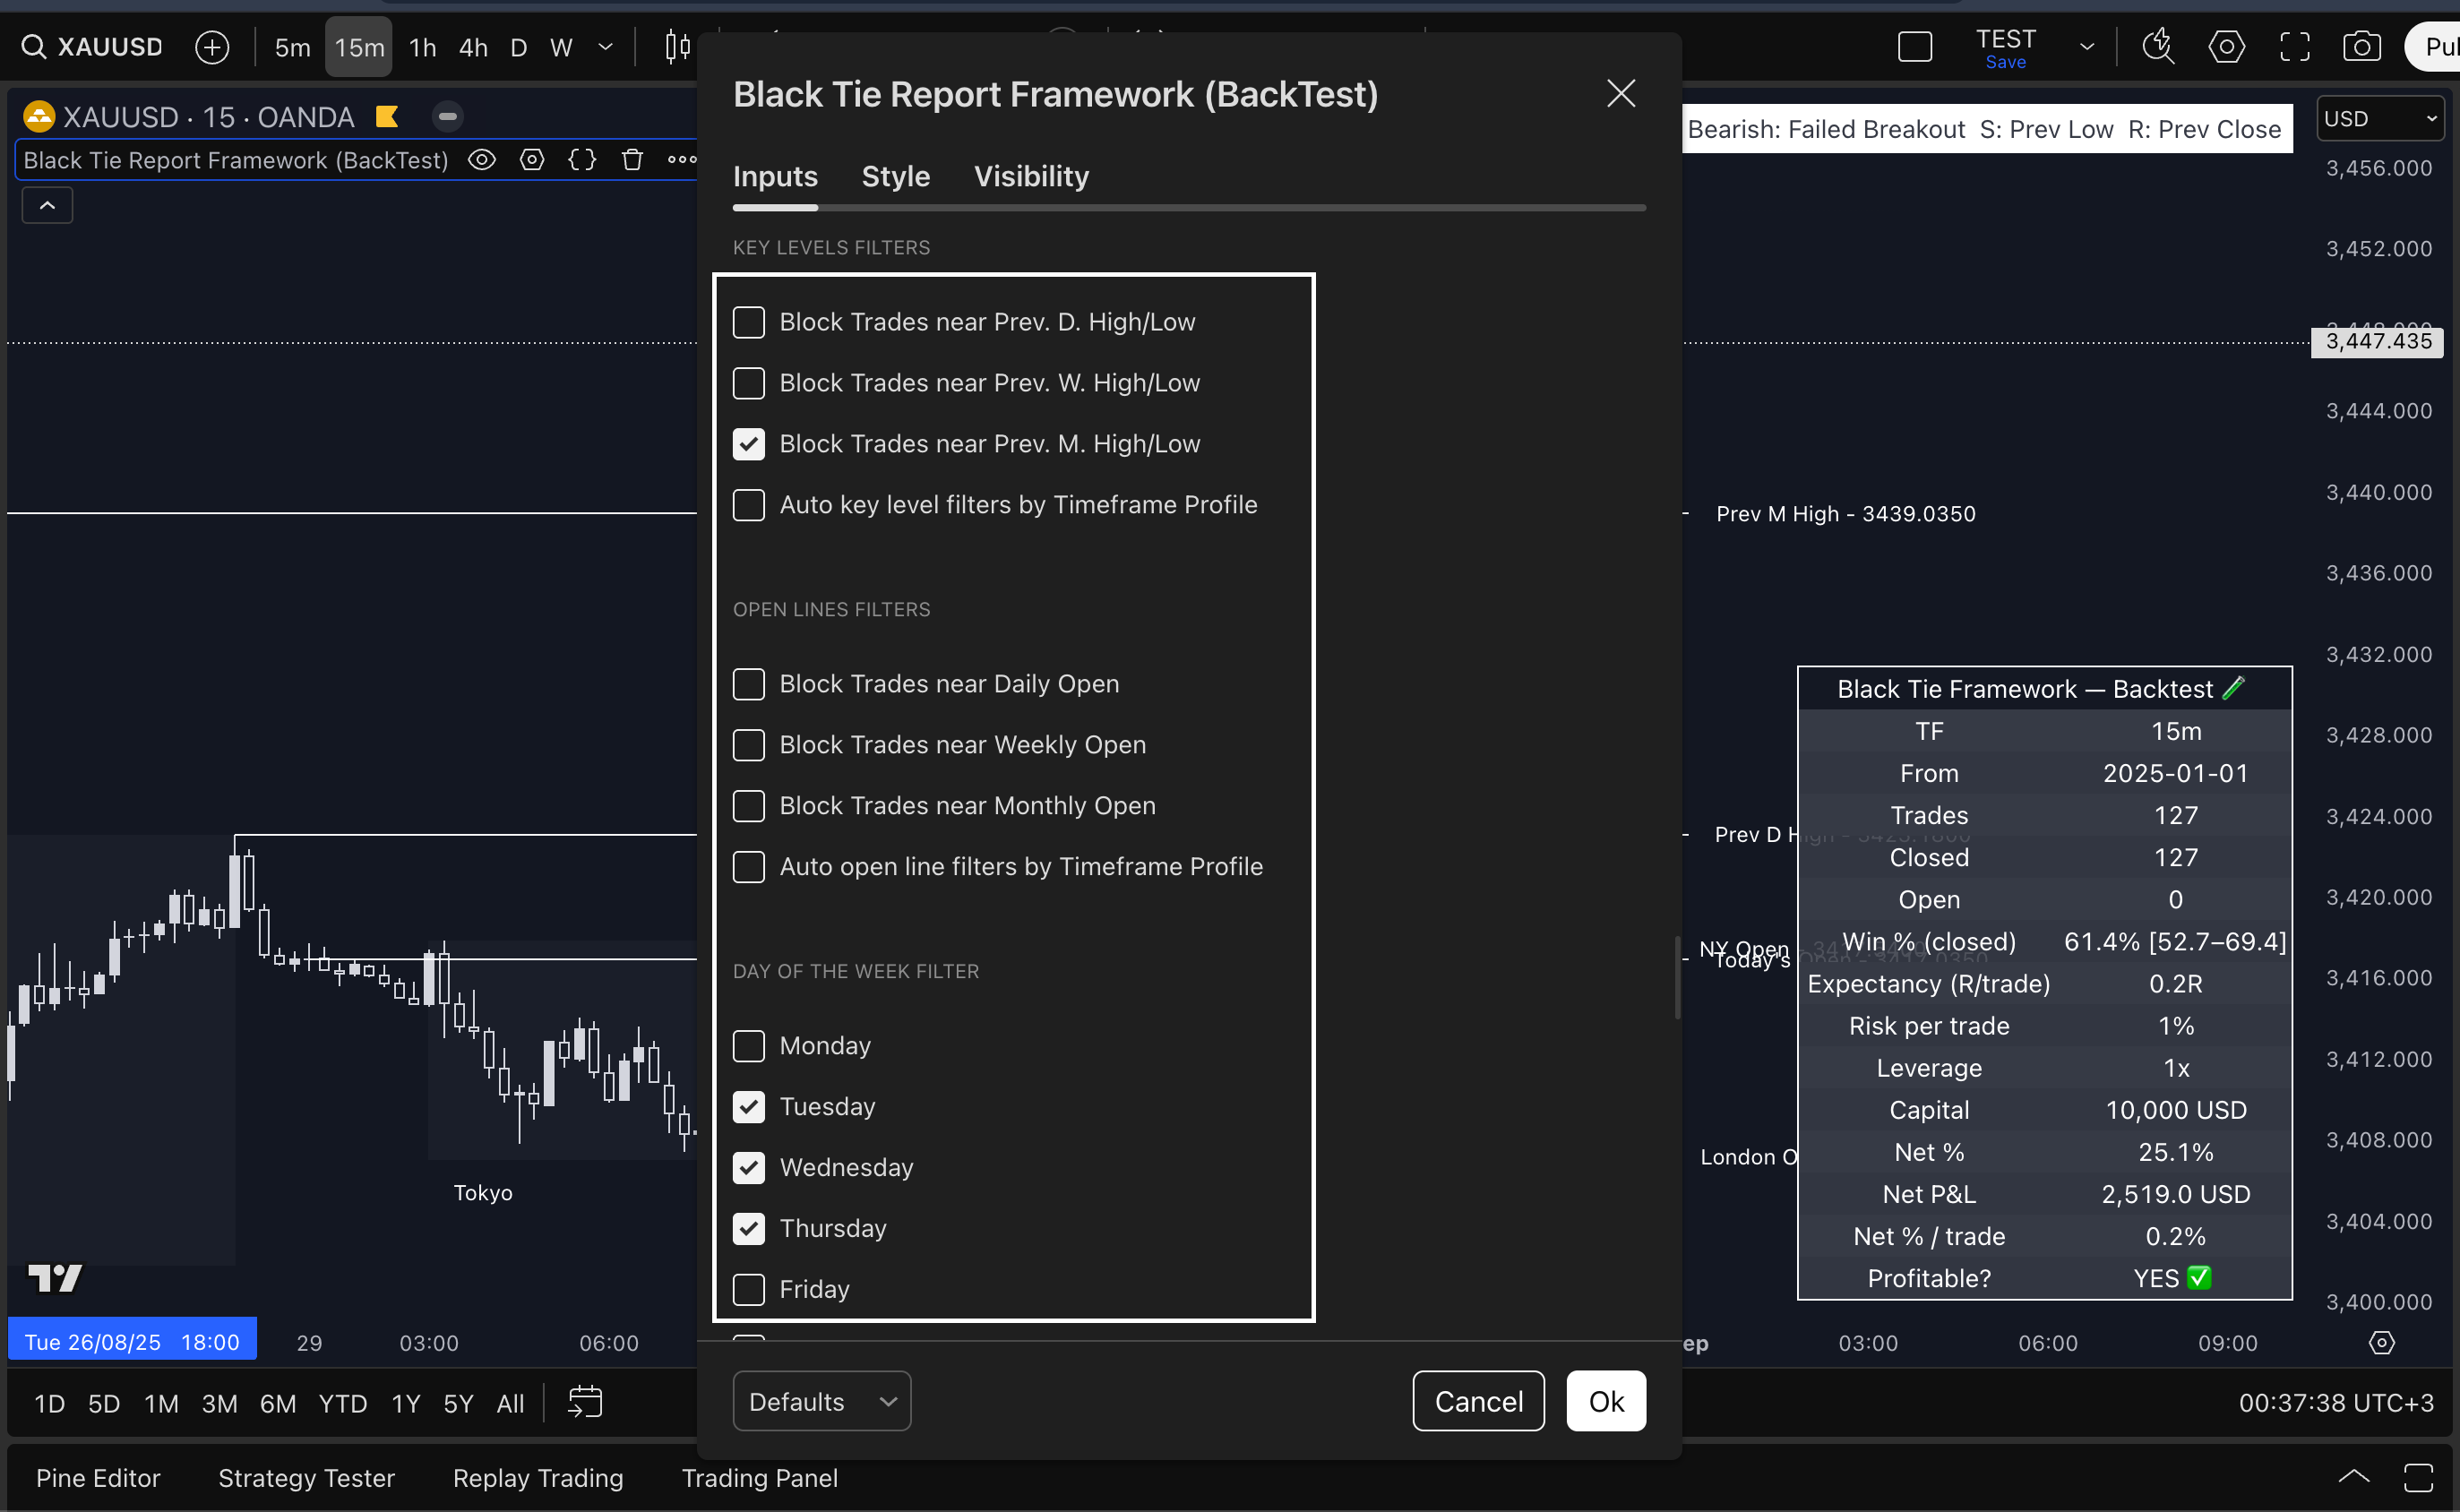
🔧 How to Use It
Simply enable the Backtest Panel in the settings and:
Choose your timeframe
Pick your asset
Select your filters (key levels, day of the week, etc.)
Choose the strategy mode (Standard, Aggressive, Conservative)
Run the chart from January 1, 2025, to today
You’ll see a full performance summary including:
Number of trades
Win rate with 95% CI
Net % and P&L
Expectancy per trade
Risk-adjusted performance
This lets you immediately answer questions like:
"How would I have performed this year on BTC 1H using Standard Mode?"
"Is Gold better on Tuesday/Thursday only?"
"What if I block trades near the Monthly Open?"
You can test that in seconds.
🔍 BTC 1H — Standard Mode, Default Settings
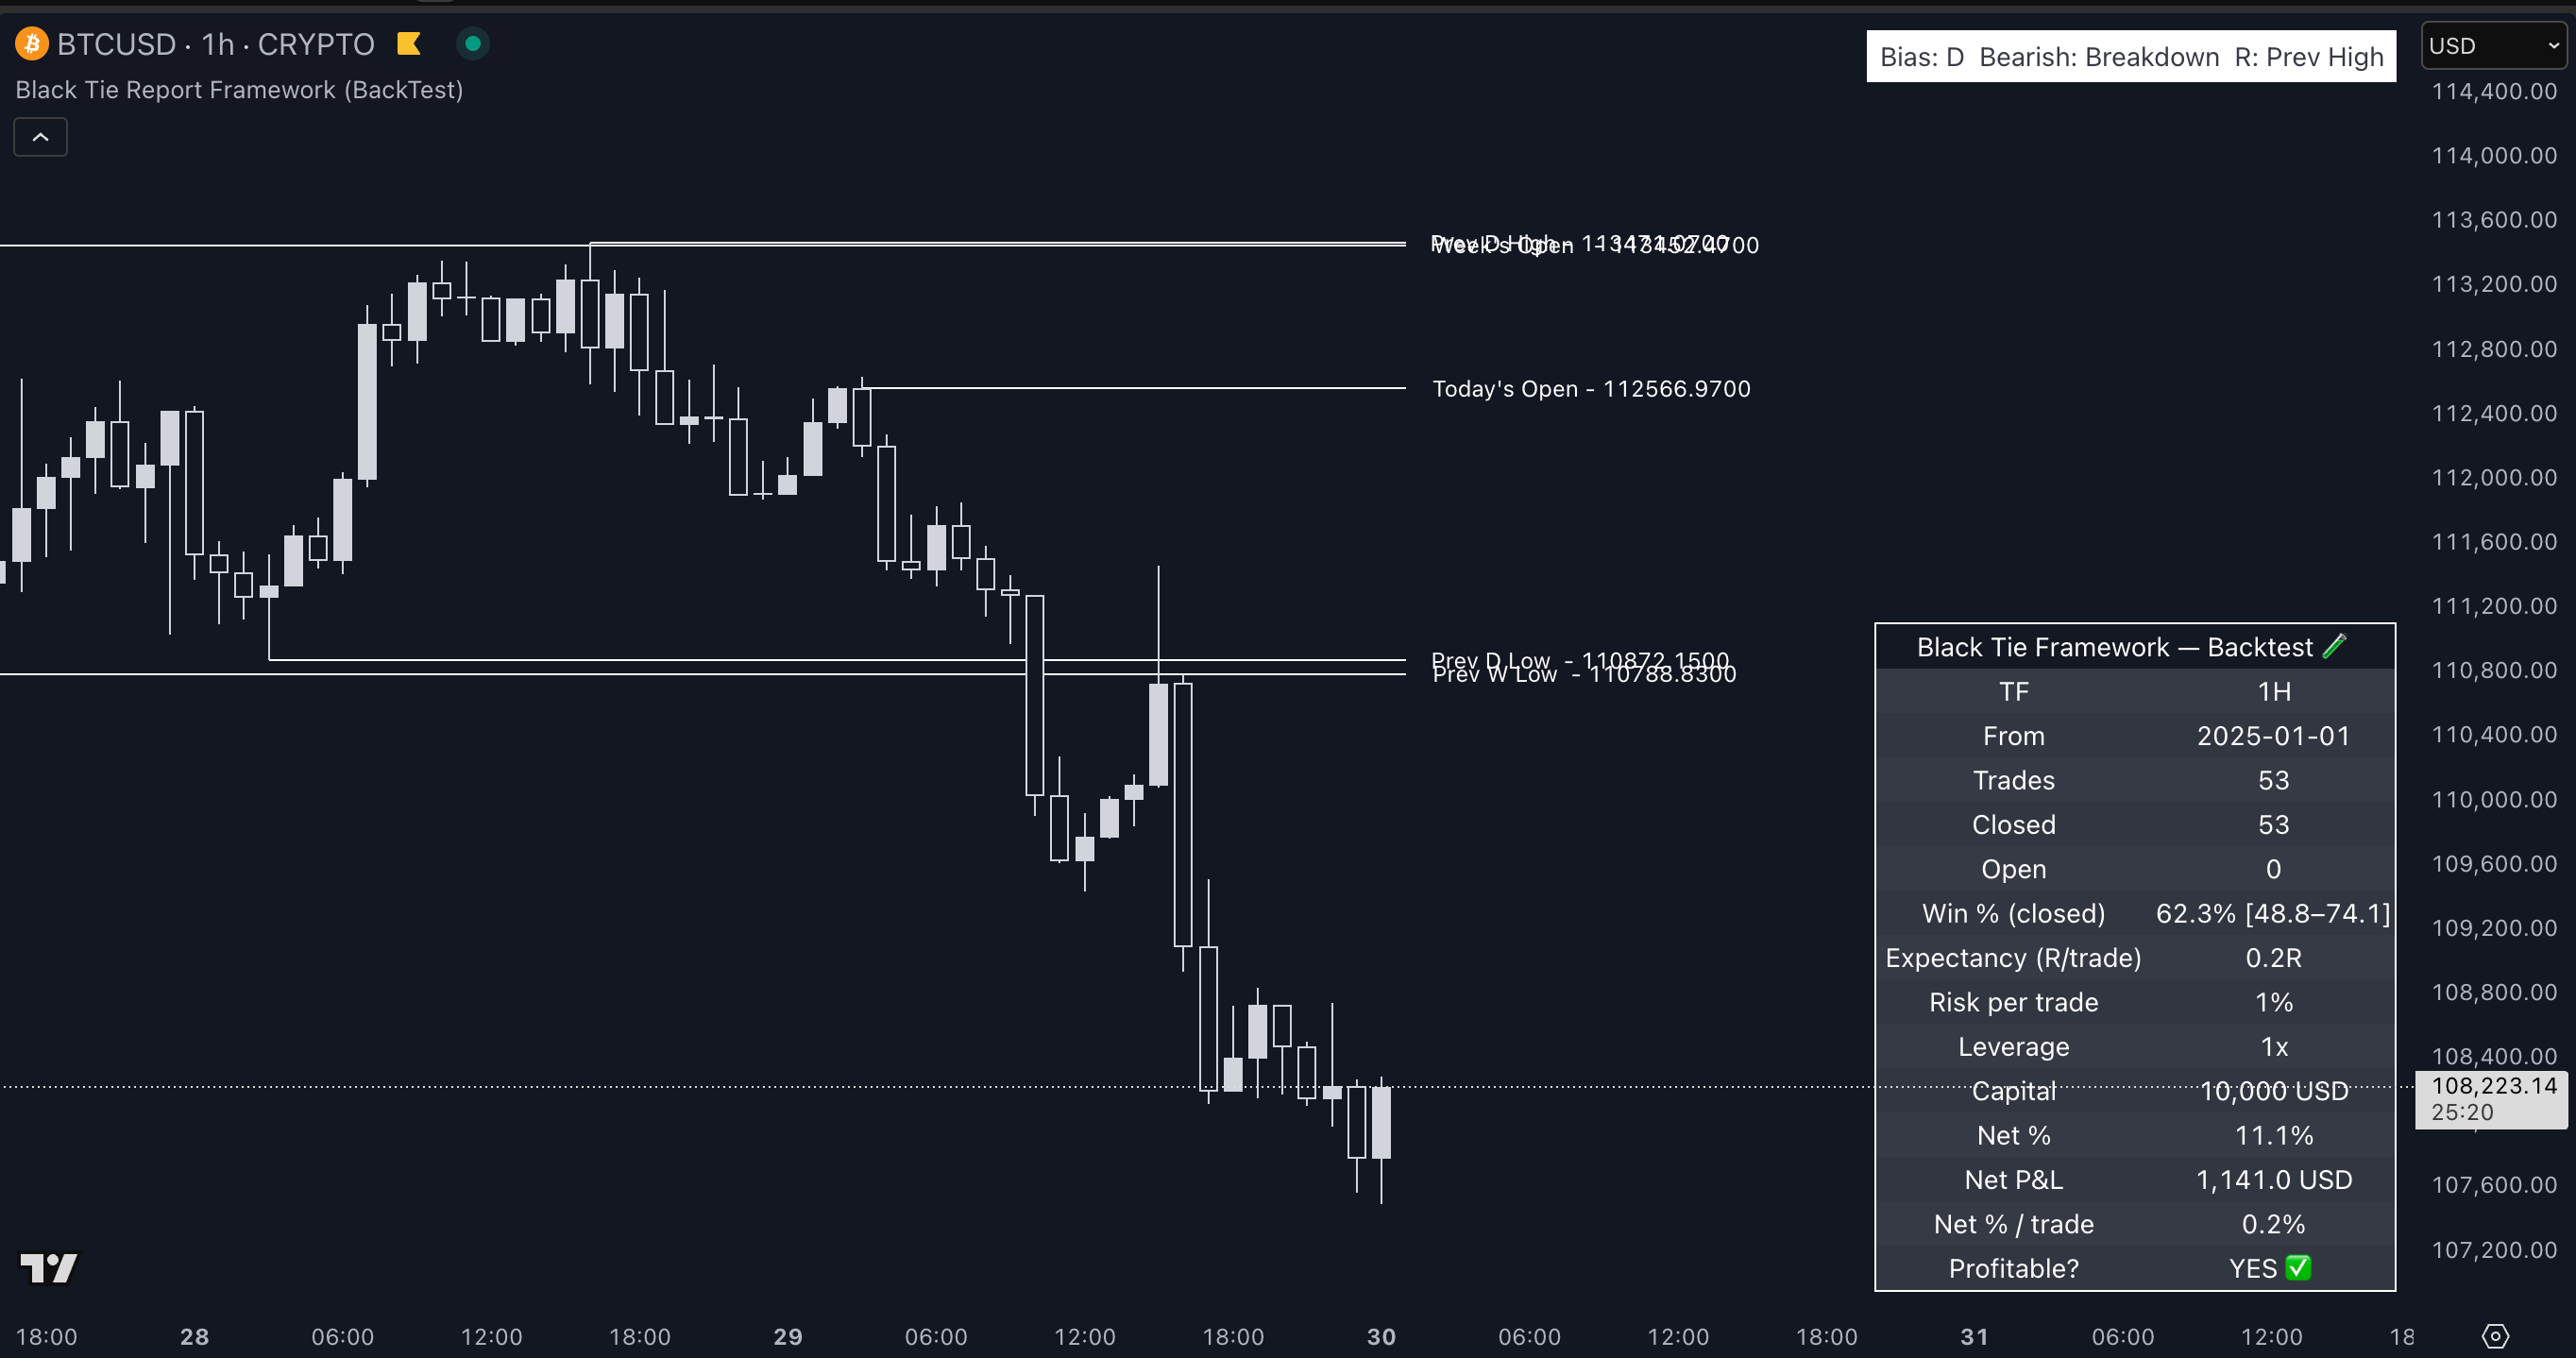
In this example, we used BTCUSD on the 1H chart with default Standard Mode.
Timeframe: 1H
Capital: 10,000 USD
Risk per trade: 1%
Trades: 53
Win %: 62.3%
Net Profit: $1,141 (11.1%) - Leverage NOT included.
A clean result on a volatile asset, showing consistent performance without any leverage.
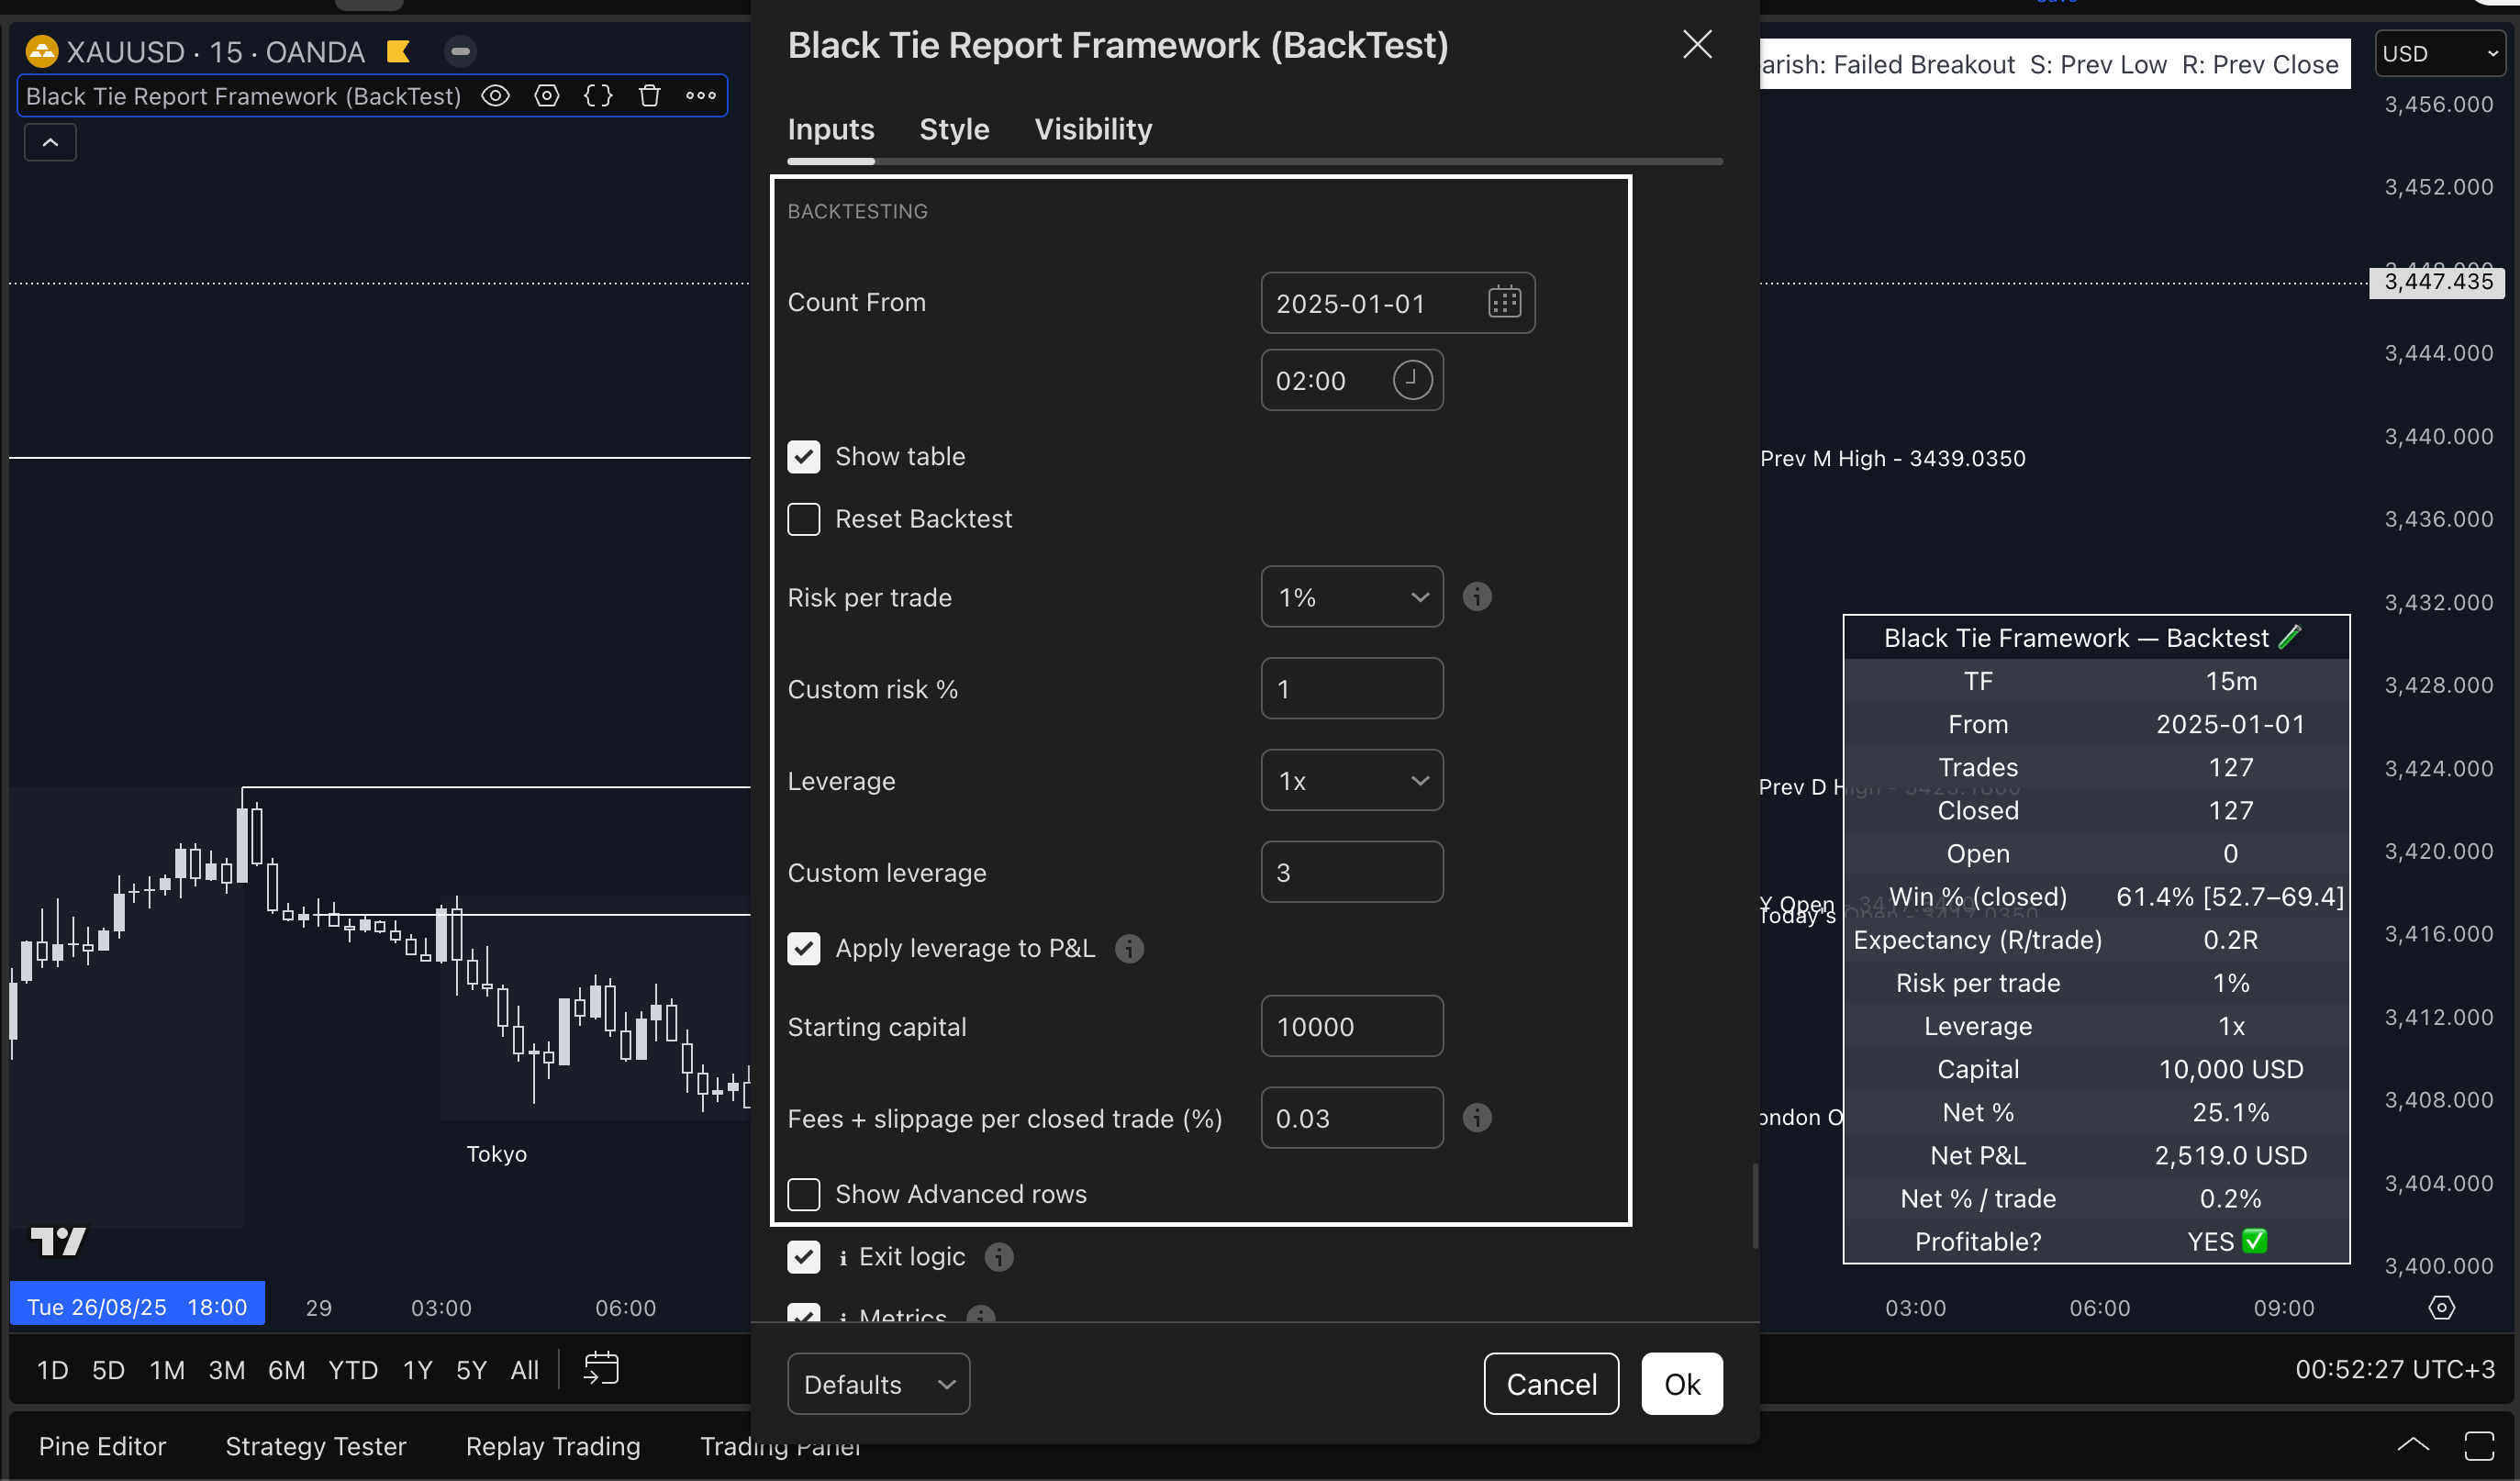
📈 XAUUSD 15m — Custom Filters Enabled
Here we used:
15m timeframe
Day filters ON (Tue-Wed-Thu)
Blocked trades near Prev. Monthly High/Low
Results:
Trades: 127
Win %: 61.4%
Net Profit: $2,519 (25.1%) - Again, this is WITHOUT Leverage (1x)
This example shows how filtering noise (levels or days) improves results. If you trade metals, this configuration works well during high-volume sessions.
📊 EURUSD 5m — Aggressive Mode
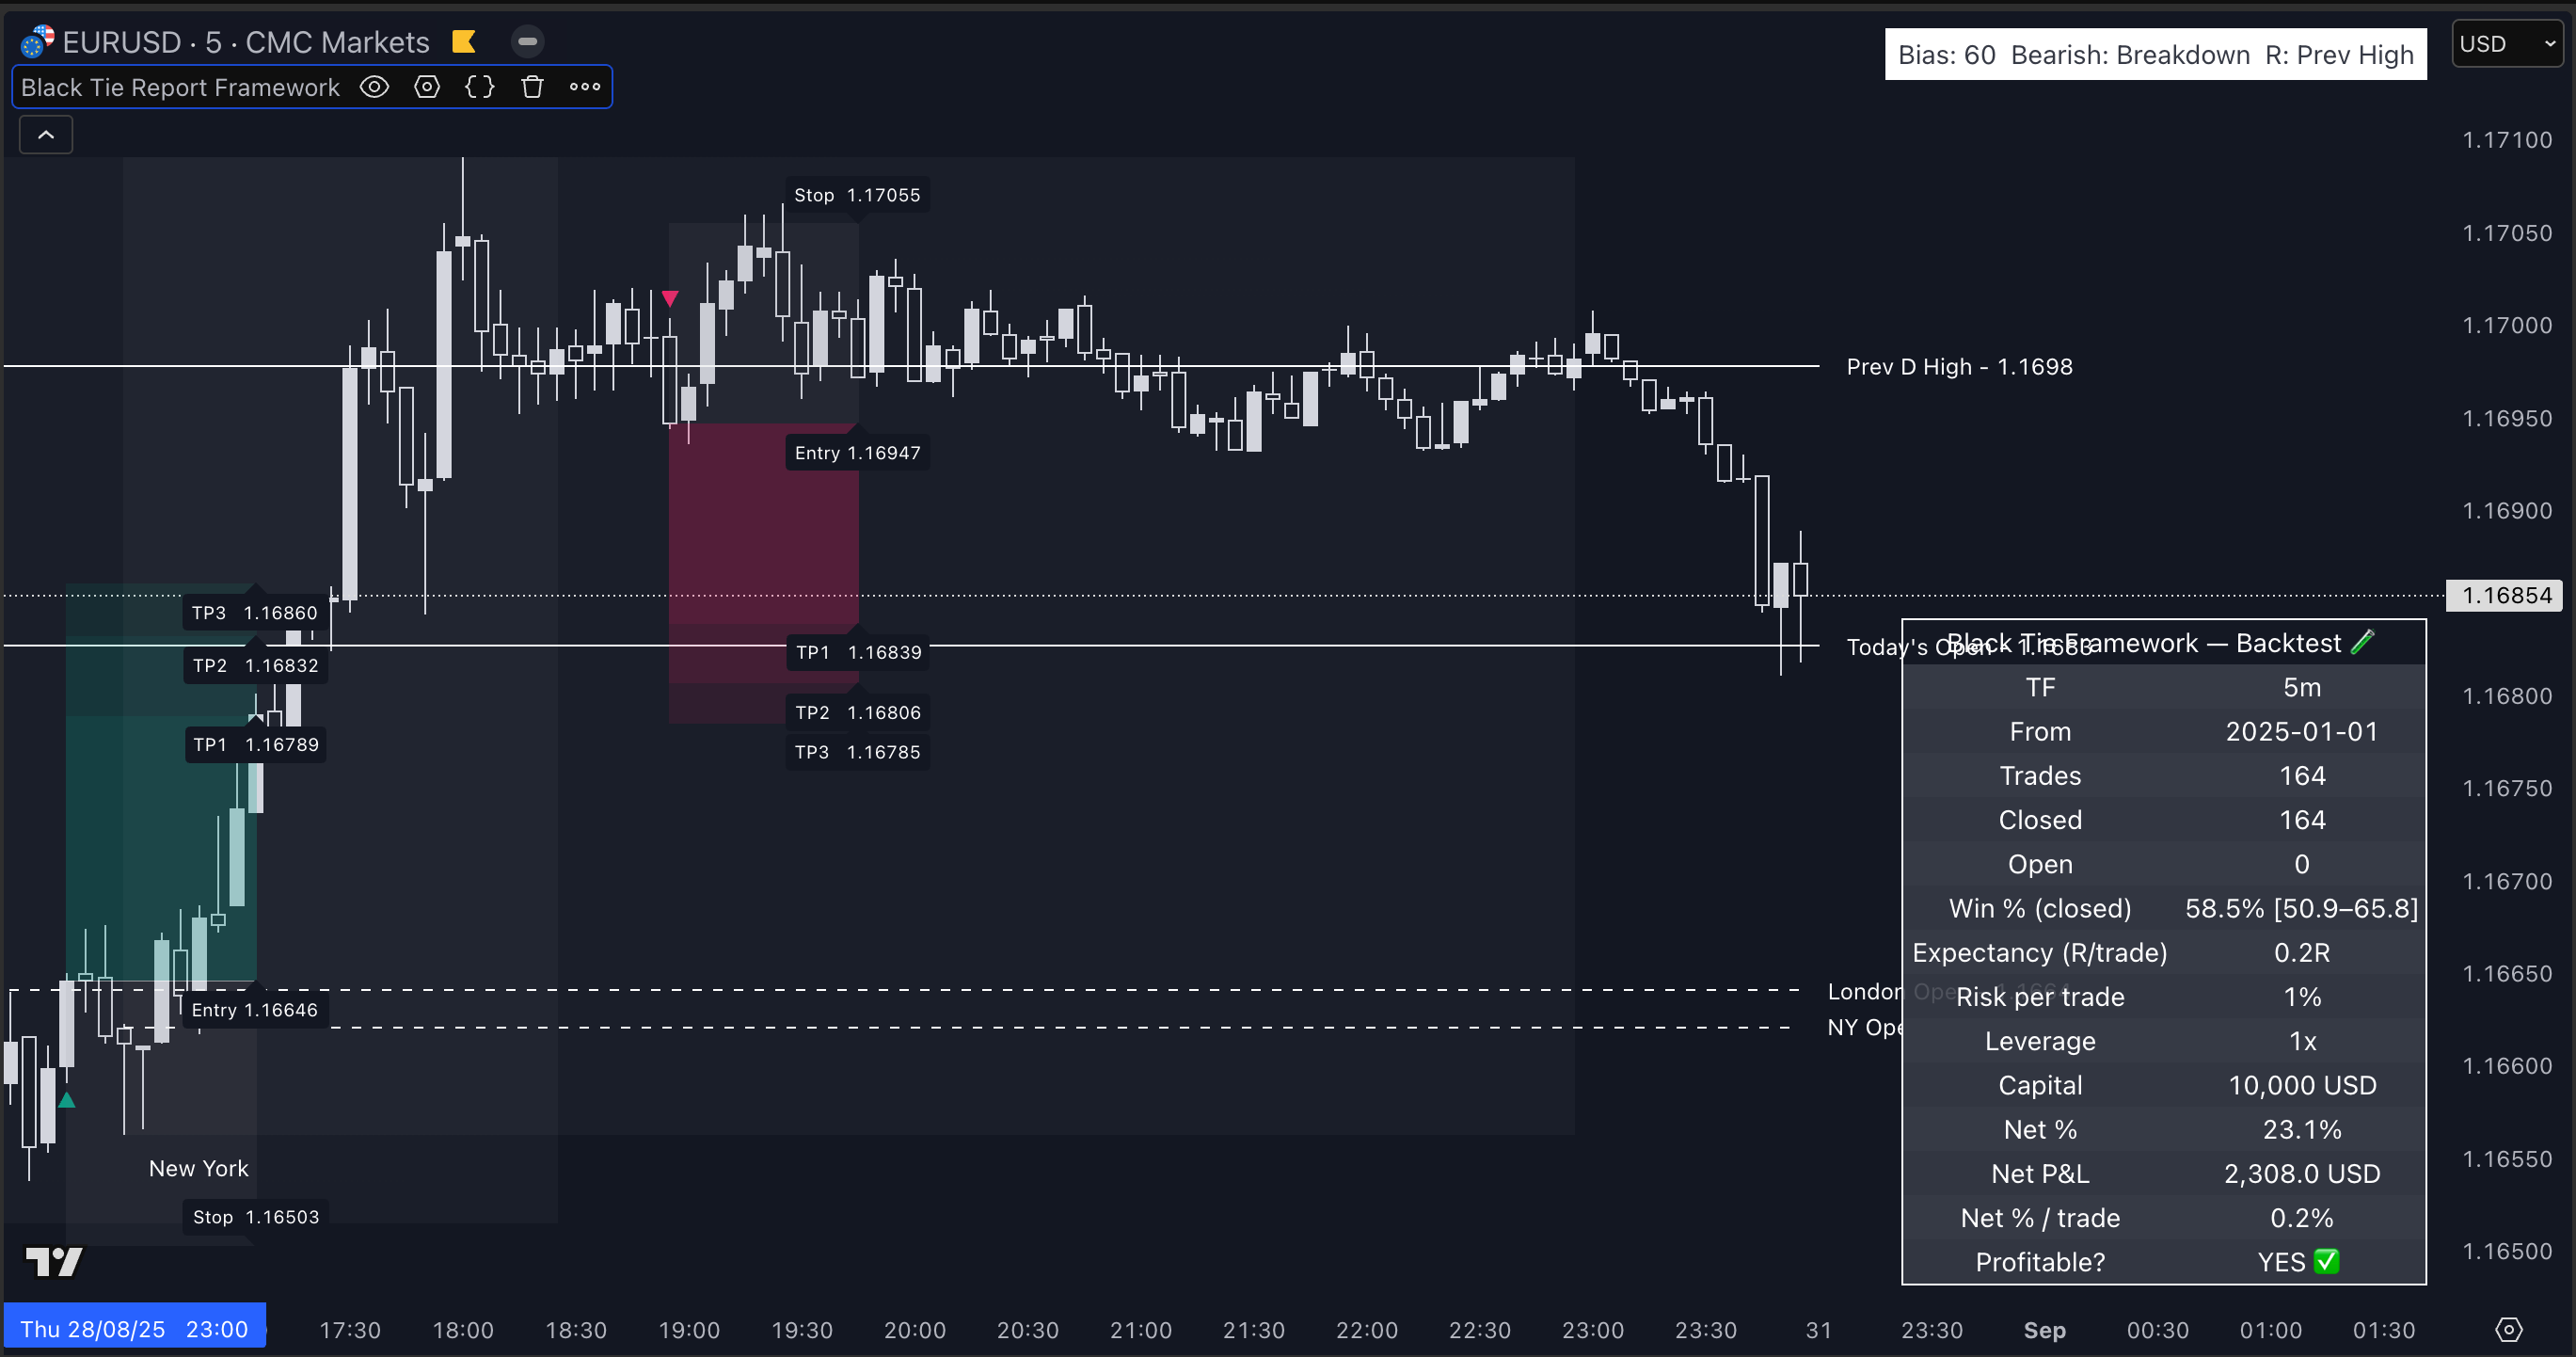
Mode: Aggressive
Timeframe: 5m
Trades: 164
Win %: 58.5%
Net %: 23.1% (always without Leverage, because we used 1x)
Net P&L: $2,308
Used on EURUSD for lower timeframes where moves are short and quick. Great for fast intraday trades when session structure aligns.
🇯🇵 USDJPY 15m — Standard Mode, Time Range OFF
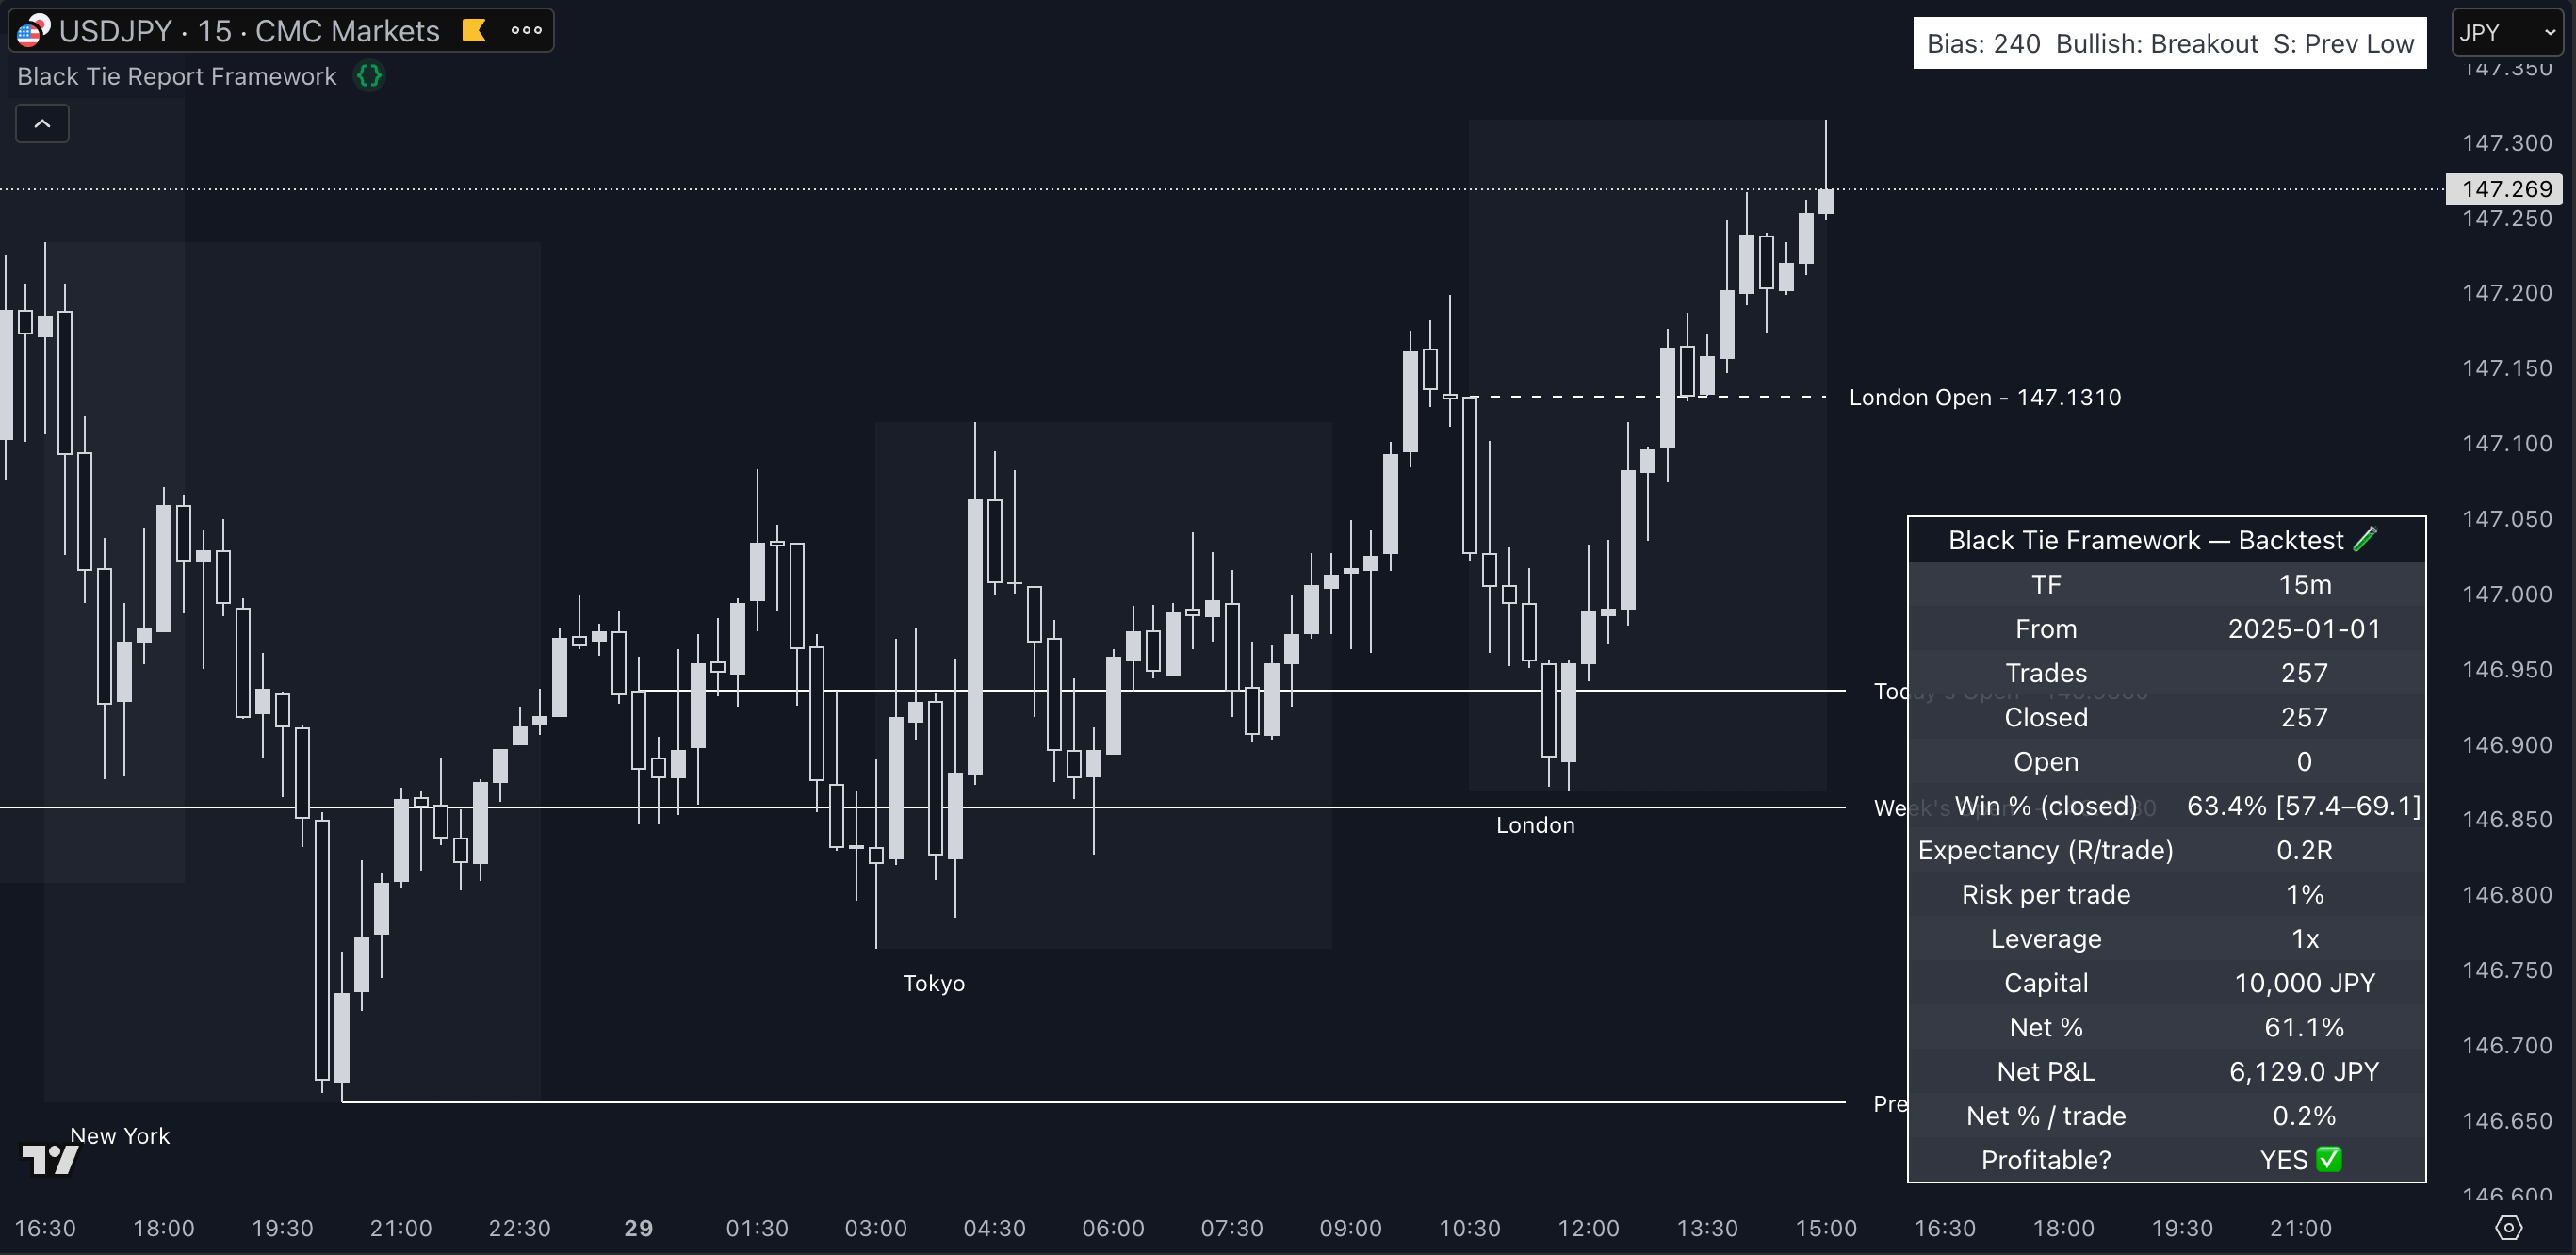
What happens if you remove the time filter and trade 24/5?
Timeframe: 15m
Trades: 257
Win %: 63.4%
Net %: 61.1% (no leverage)
Profit: 6,129 JPY
Solid result from a clean FX pair. Even without a time filter, the Framework holds up on structured assets like USDJPY.
🌎 NAS100 15m — Standard Mode
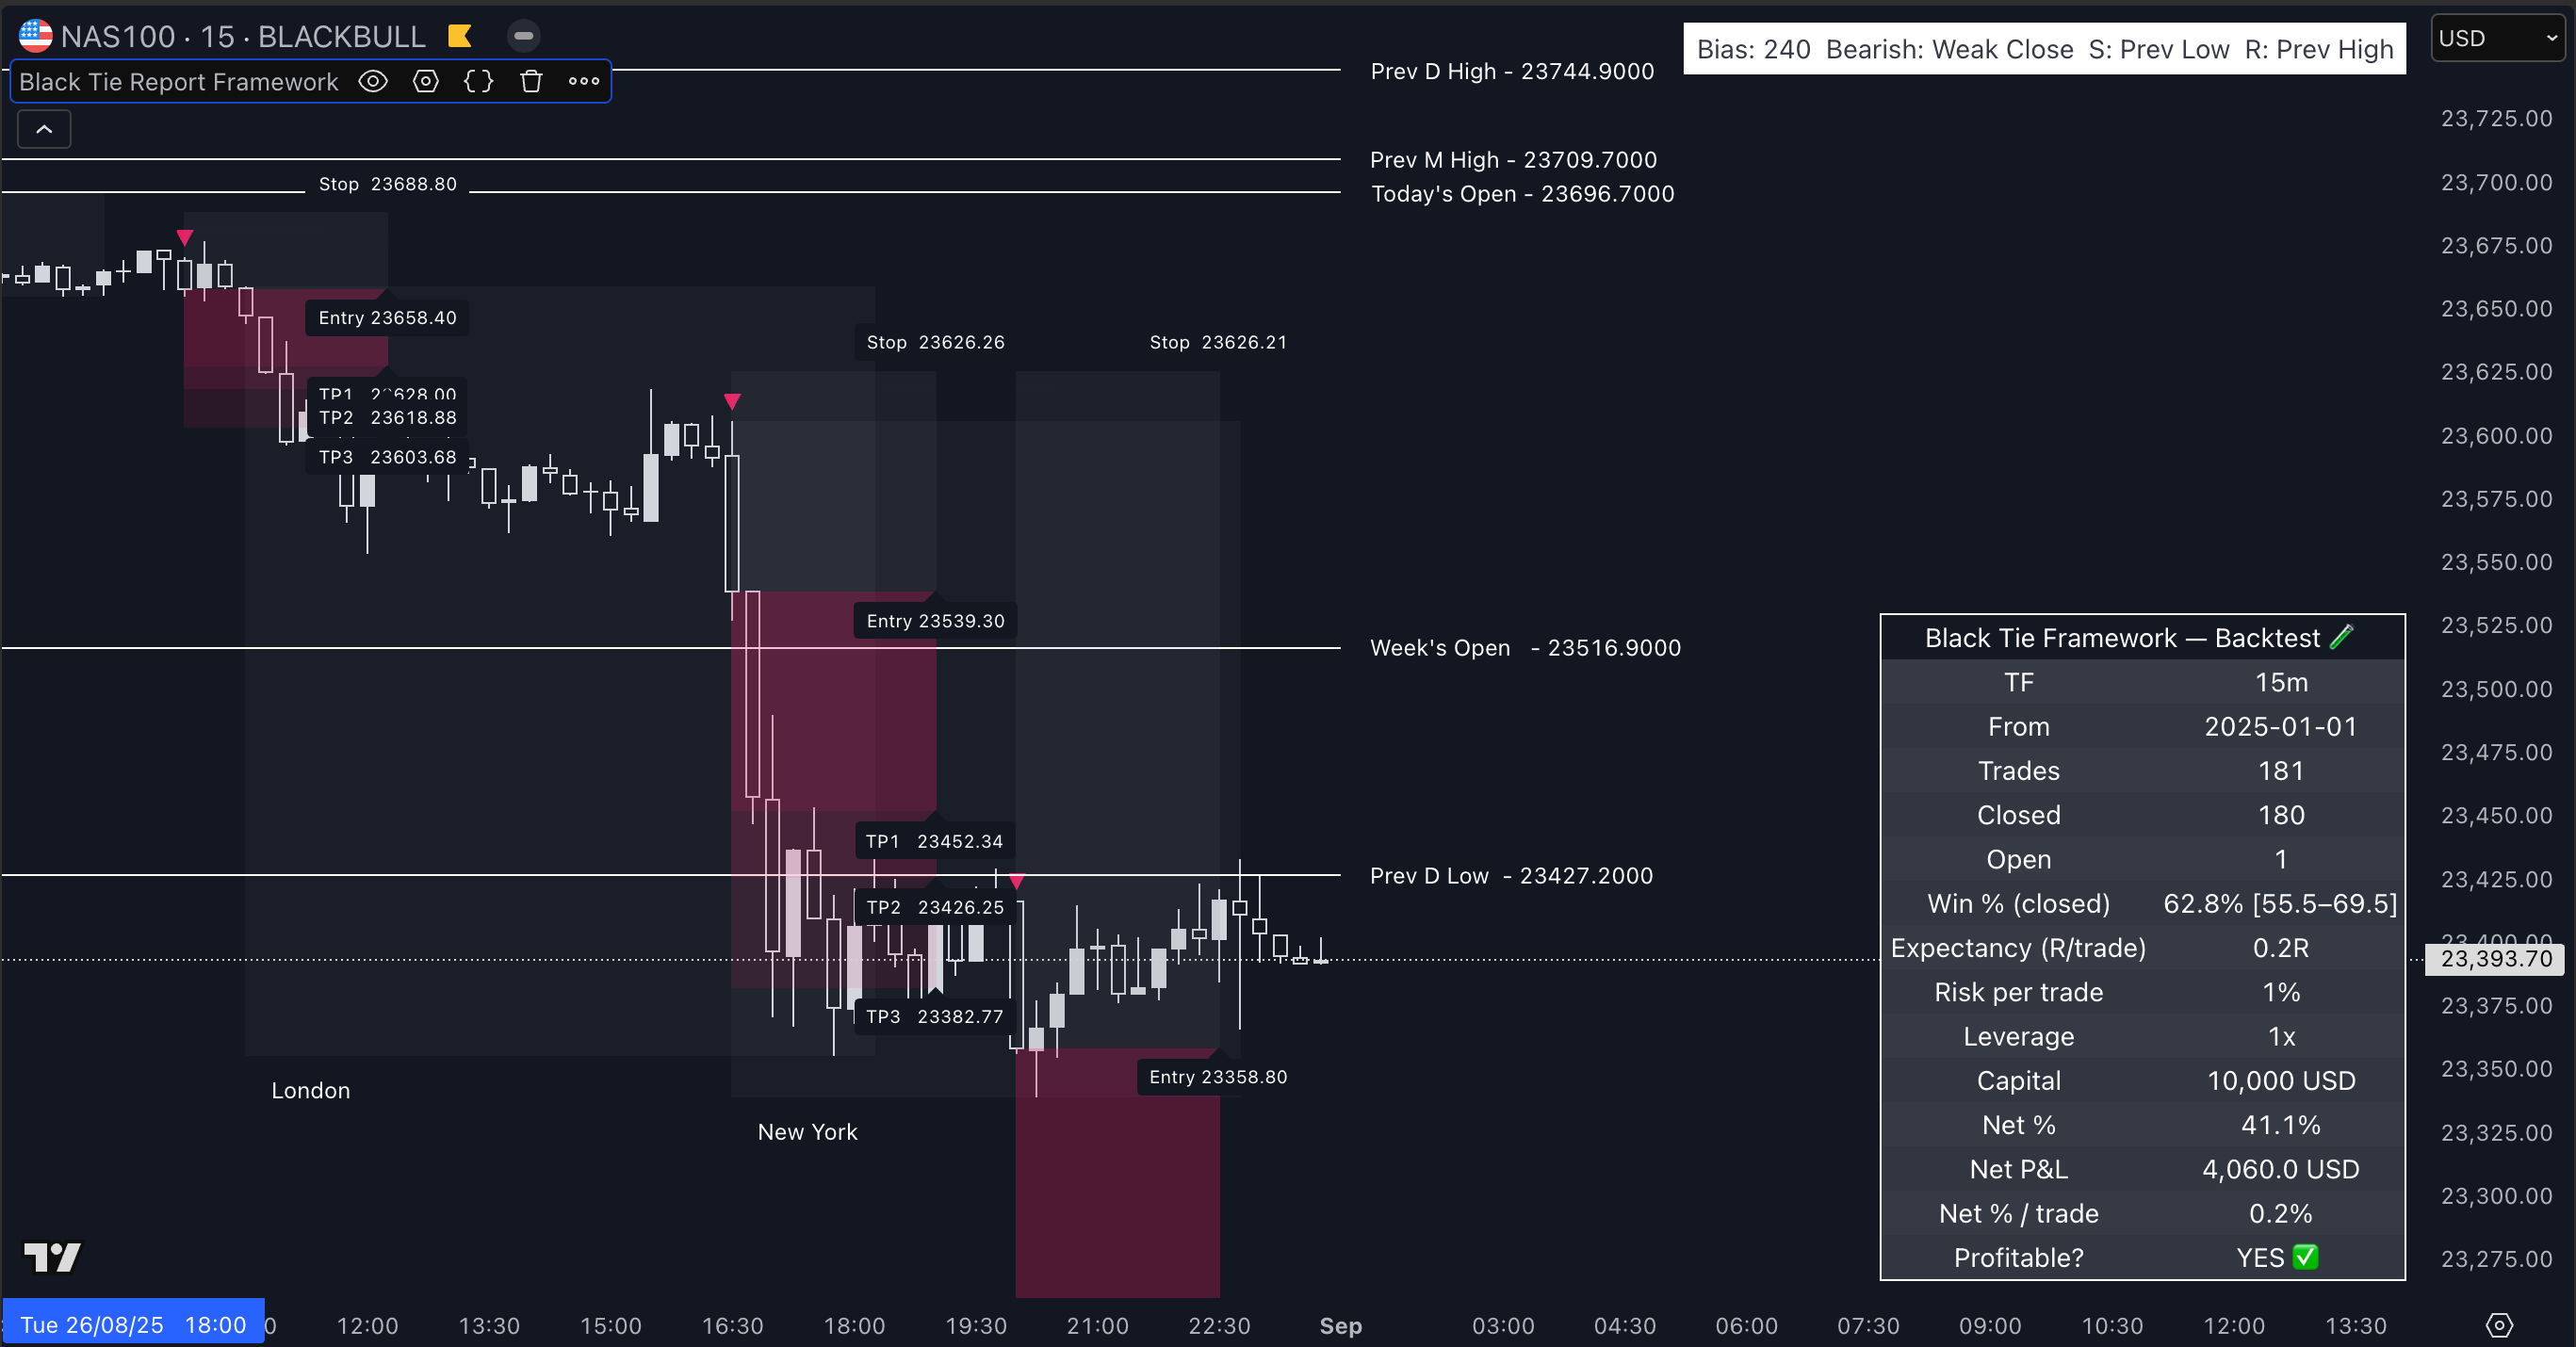
Timeframe: 15m
Win Rate: 62.8%
Trades: 181
Net %: 41.1%
Profit: $4,060
This was tested across full NY session behavior. NAS100 is volatile, but this shows how the Framework captures clean impulses and filters fakeouts.
🌌 SOLUSDT 1H — Standard Mode, Time Filter OFF
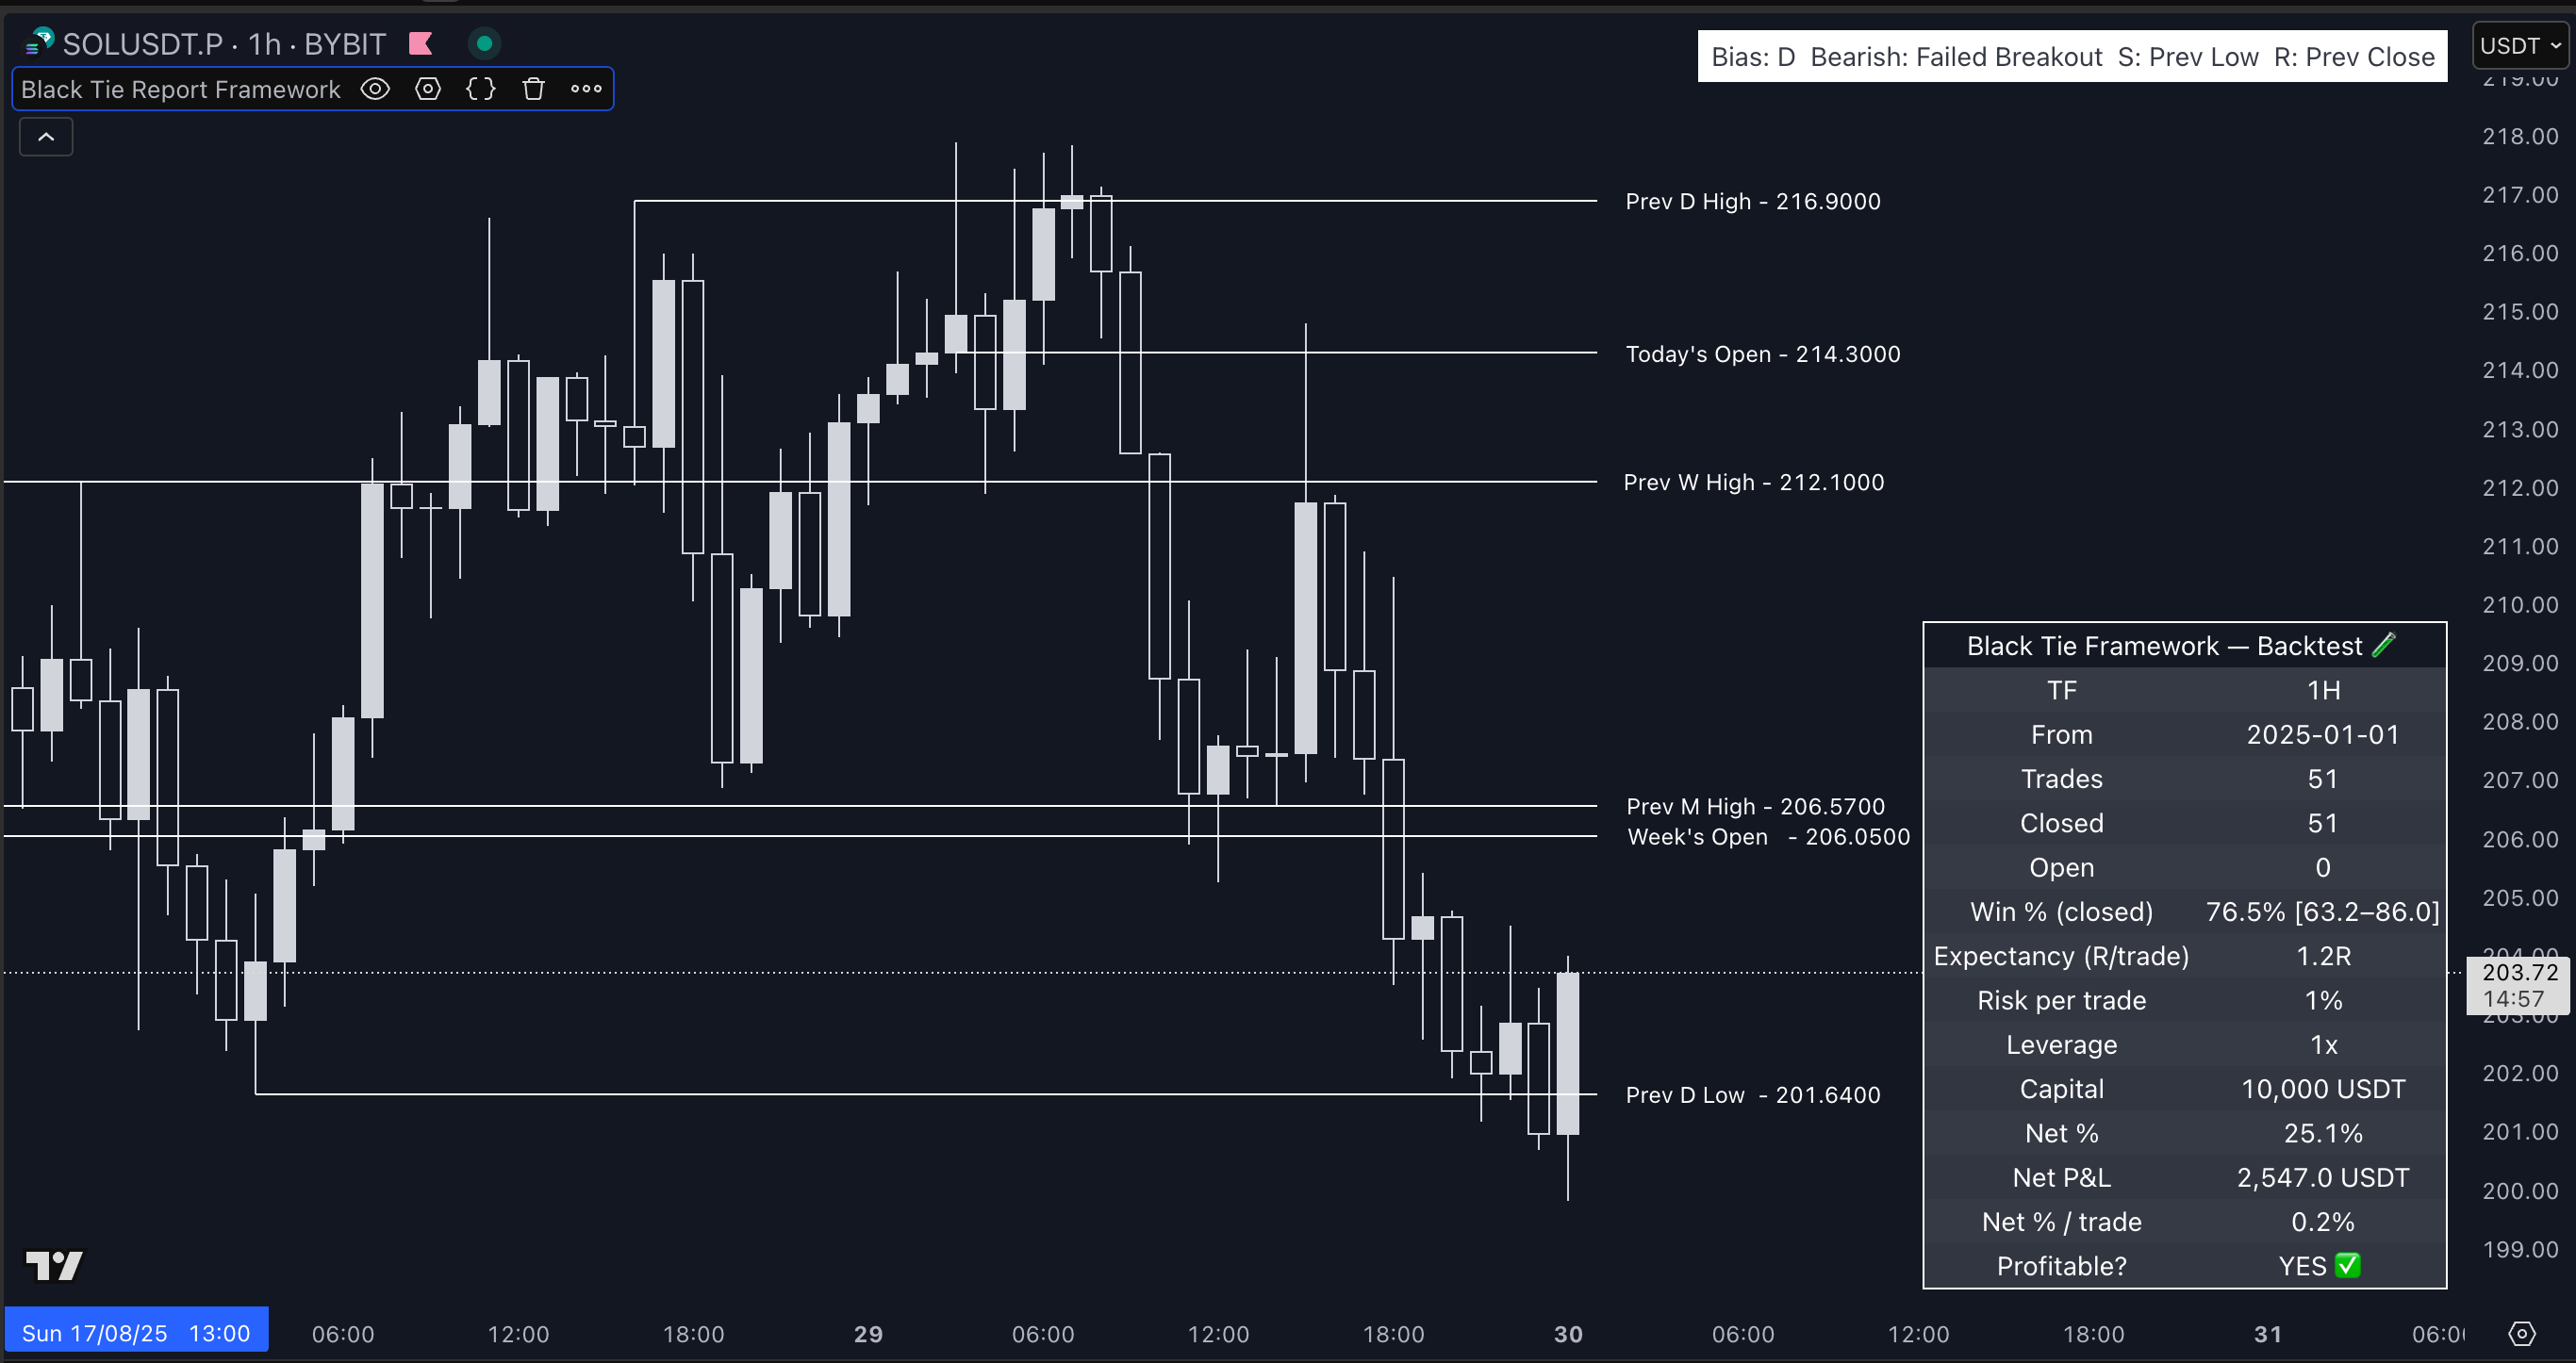
On SOL we tested without session filter:
Trades: 51
Win %: 76.5%
Expectancy: 1.2R (exceptional)
Net %: 25.1% (leverage 1x)
Profit: $2,547
Notice how this outperformed all others in terms of expectancy. When a trend holds, even SOL respects structure.
💡 DOGEUSDT 15m — Standard Mode
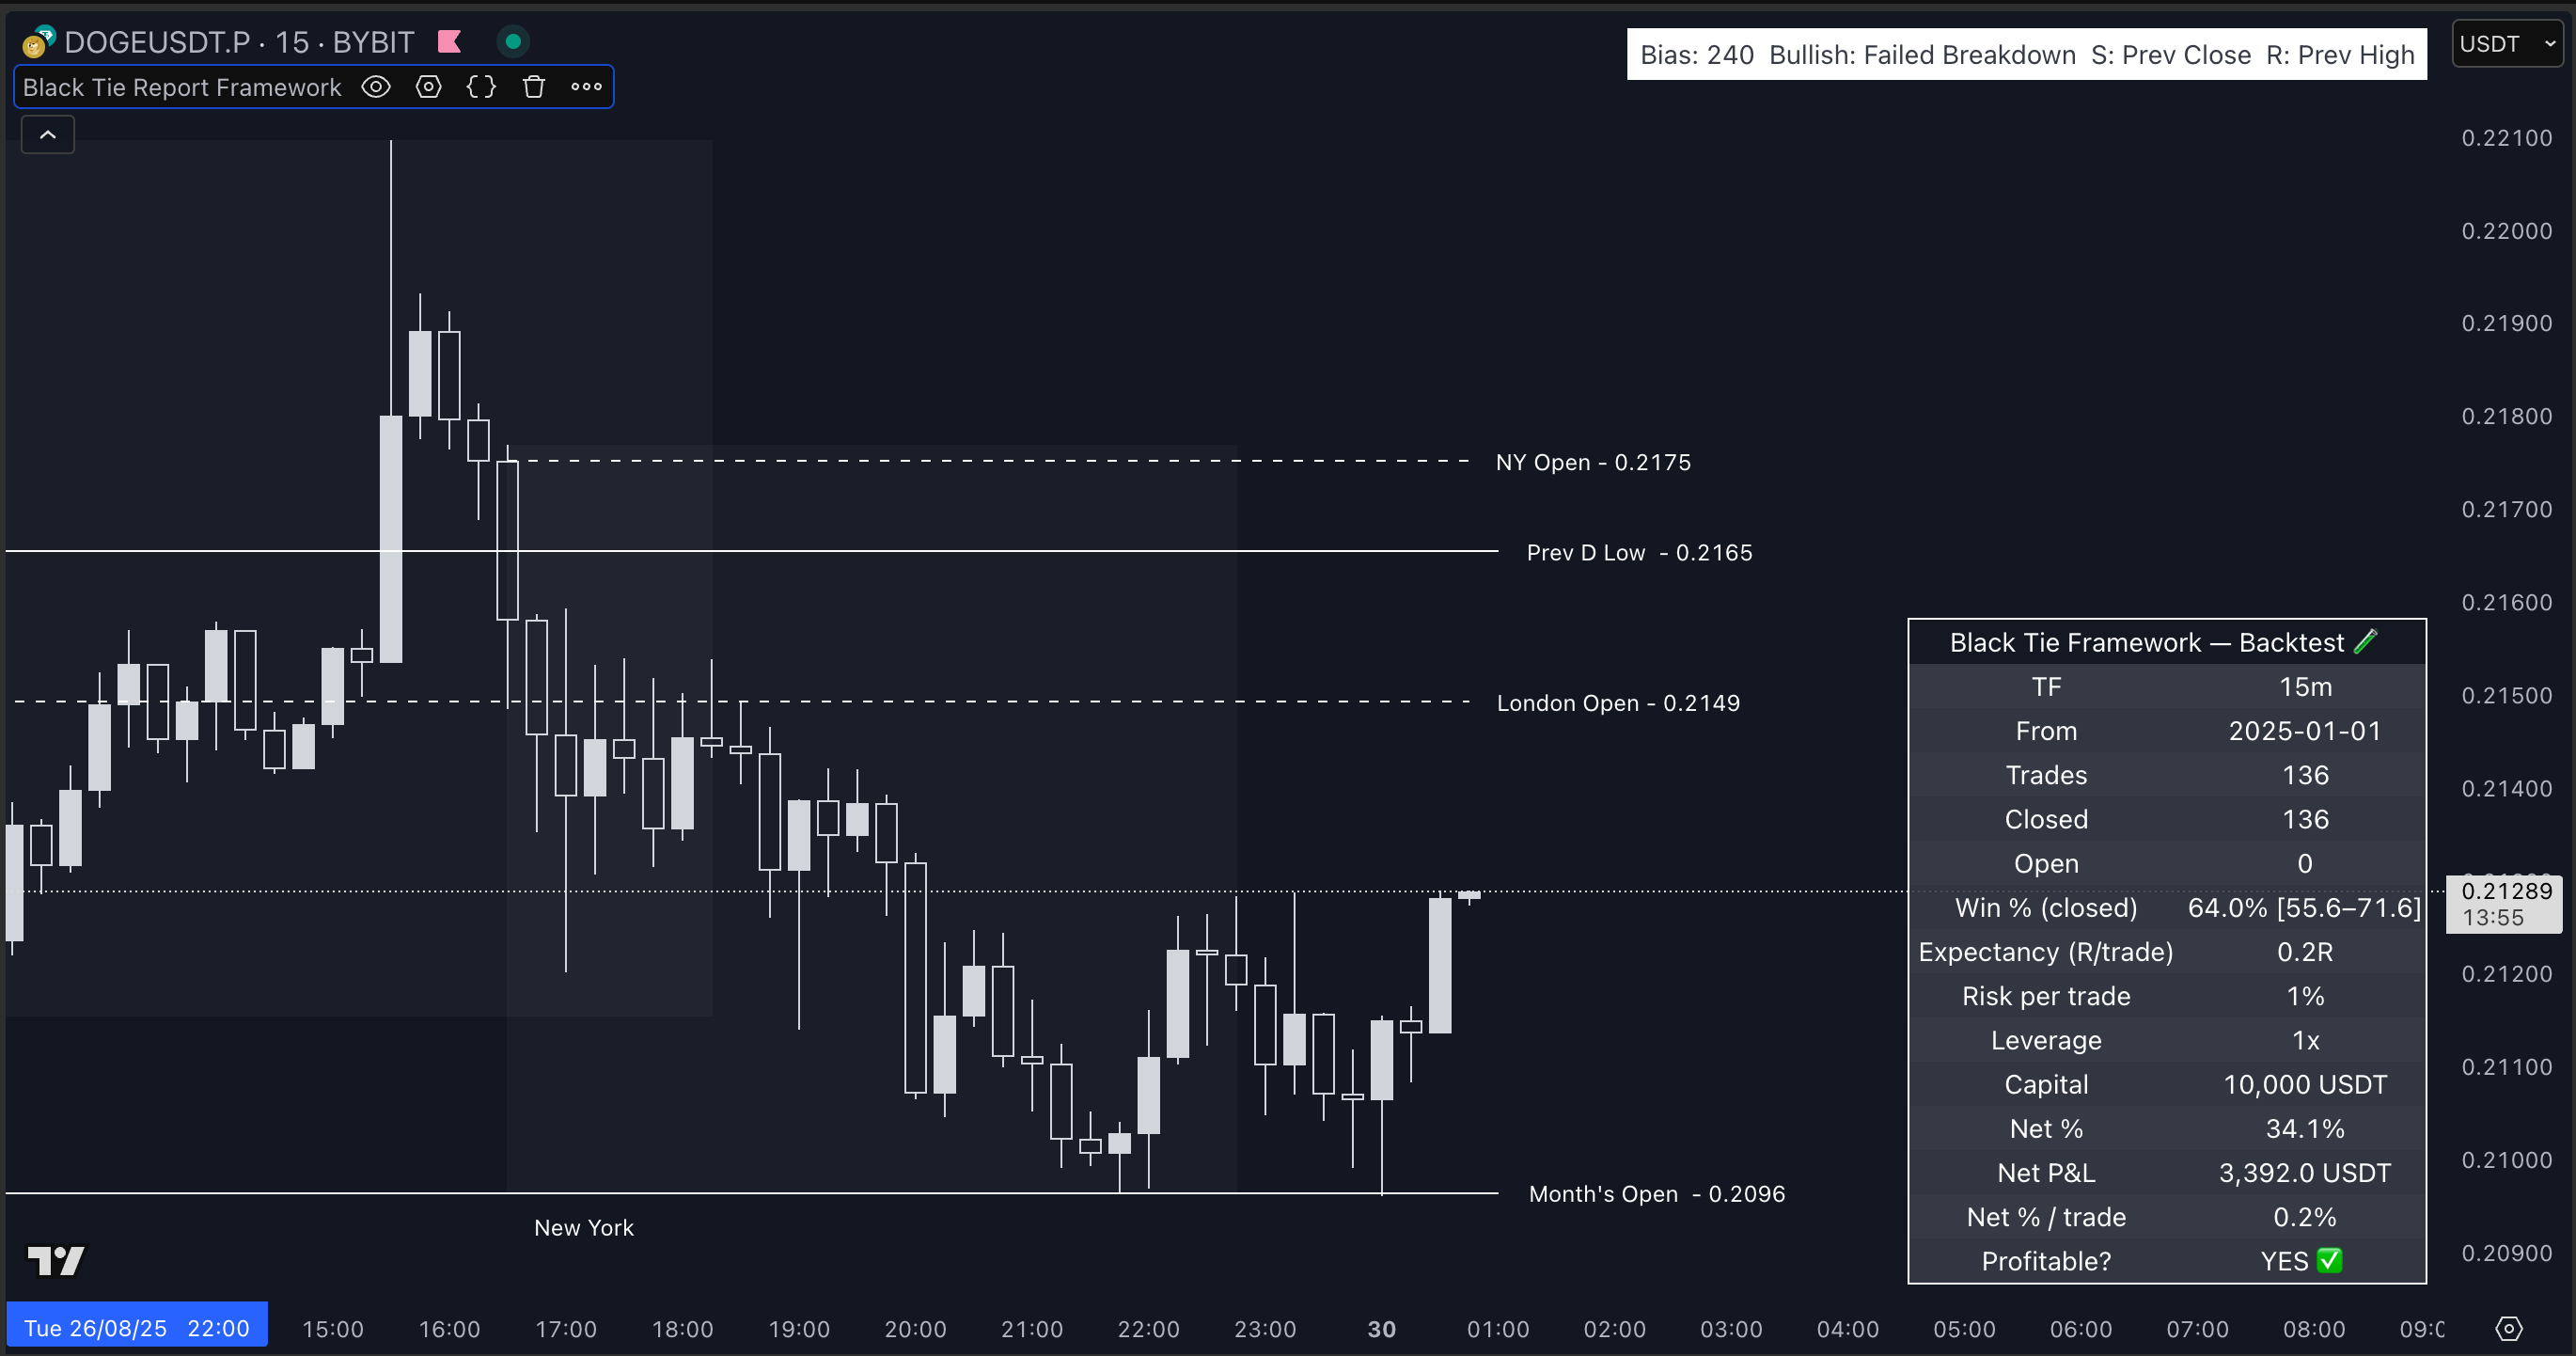
Timeframe: 15m
Win Rate: 64.0%
Profit: $3,392
Expectancy: 0.2R
DOGE may look chaotic, but this backtest proves it can be systematically traded when conditions align.
⚖️ Why This Backtest Module Matters
We're not selling signals. We're not pretending every trade wins.
We're giving you:
A transparent method to validate what works
Live data from your chart and preferences
Custom filters that adjust to your strategy
This module saves time, money, and emotional fatigue.
And it puts the question to rest:
Is the Framework profitable?
You can now answer that yourself, in any asset, any timeframe.
✅ Try It Yourself
The Backtest Panel is live now.
Just open the indicator and scroll to the bottom settings.
Pick your mode. Pick your filters. Run it.
You can:
Backtest conservative trades in Gold
Validate NY-only setups on NAS100
Compare crypto majors during volatility
And best of all, it runs on any plan, on any chart.
🚀 Start With Just One Month
Give it 30 days. Track your preferred pairs. Compare timeframes.
You’ll quickly see what works for you.
This is not theoretical. It’s not marketing.
It’s a tested tool, built for traders who are done guessing.
Have a nice weekend!