
How the Black Tie Framework Performed on NFP + Unemployment Rate Day
A professional breakdown of trade performance across Forex and Indices using real-time entries, structure-based execution, and fully quantified setups.

Friday, September 5, 2025.
The day of the Non-Farm Payrolls (NFP) and US Unemployment Rate reports — two of the most impactful economic releases for USD-related assets.
These events are notorious for creating volatility, fakeouts, and sharp reversals. For most traders, it’s a dangerous day to trade. But for those using the Black Tie Report Framework, the story was different.
In this report, we’ll analyze how the Framework handled the NFP session, the quality of each trade suggested by the system, and what the backtesting module confirms about the strategy’s performance over time.
We’ll also discuss the time-saving value of this tool for people who want to simplify their execution while maintaining consistency and discipline.
Market Context: NFP and the USD Impact
At exactly 15:30 UTC, three red folder events dropped:
Non-Farm Payrolls: Actual 22K vs Forecast 75K (a major miss)
Unemployment Rate: Rose to 4.3%
Average Hourly Earnings: Below expectations
The result? A massive spike in volatility across major USD pairs and indices. These events can invalidate setups, trigger liquidity grabs, and create false breakouts — unless your strategy is designed to filter structure, session timing, and key levels, like Black Tie does.
EURUSD – Bullish Continuation from London into NY
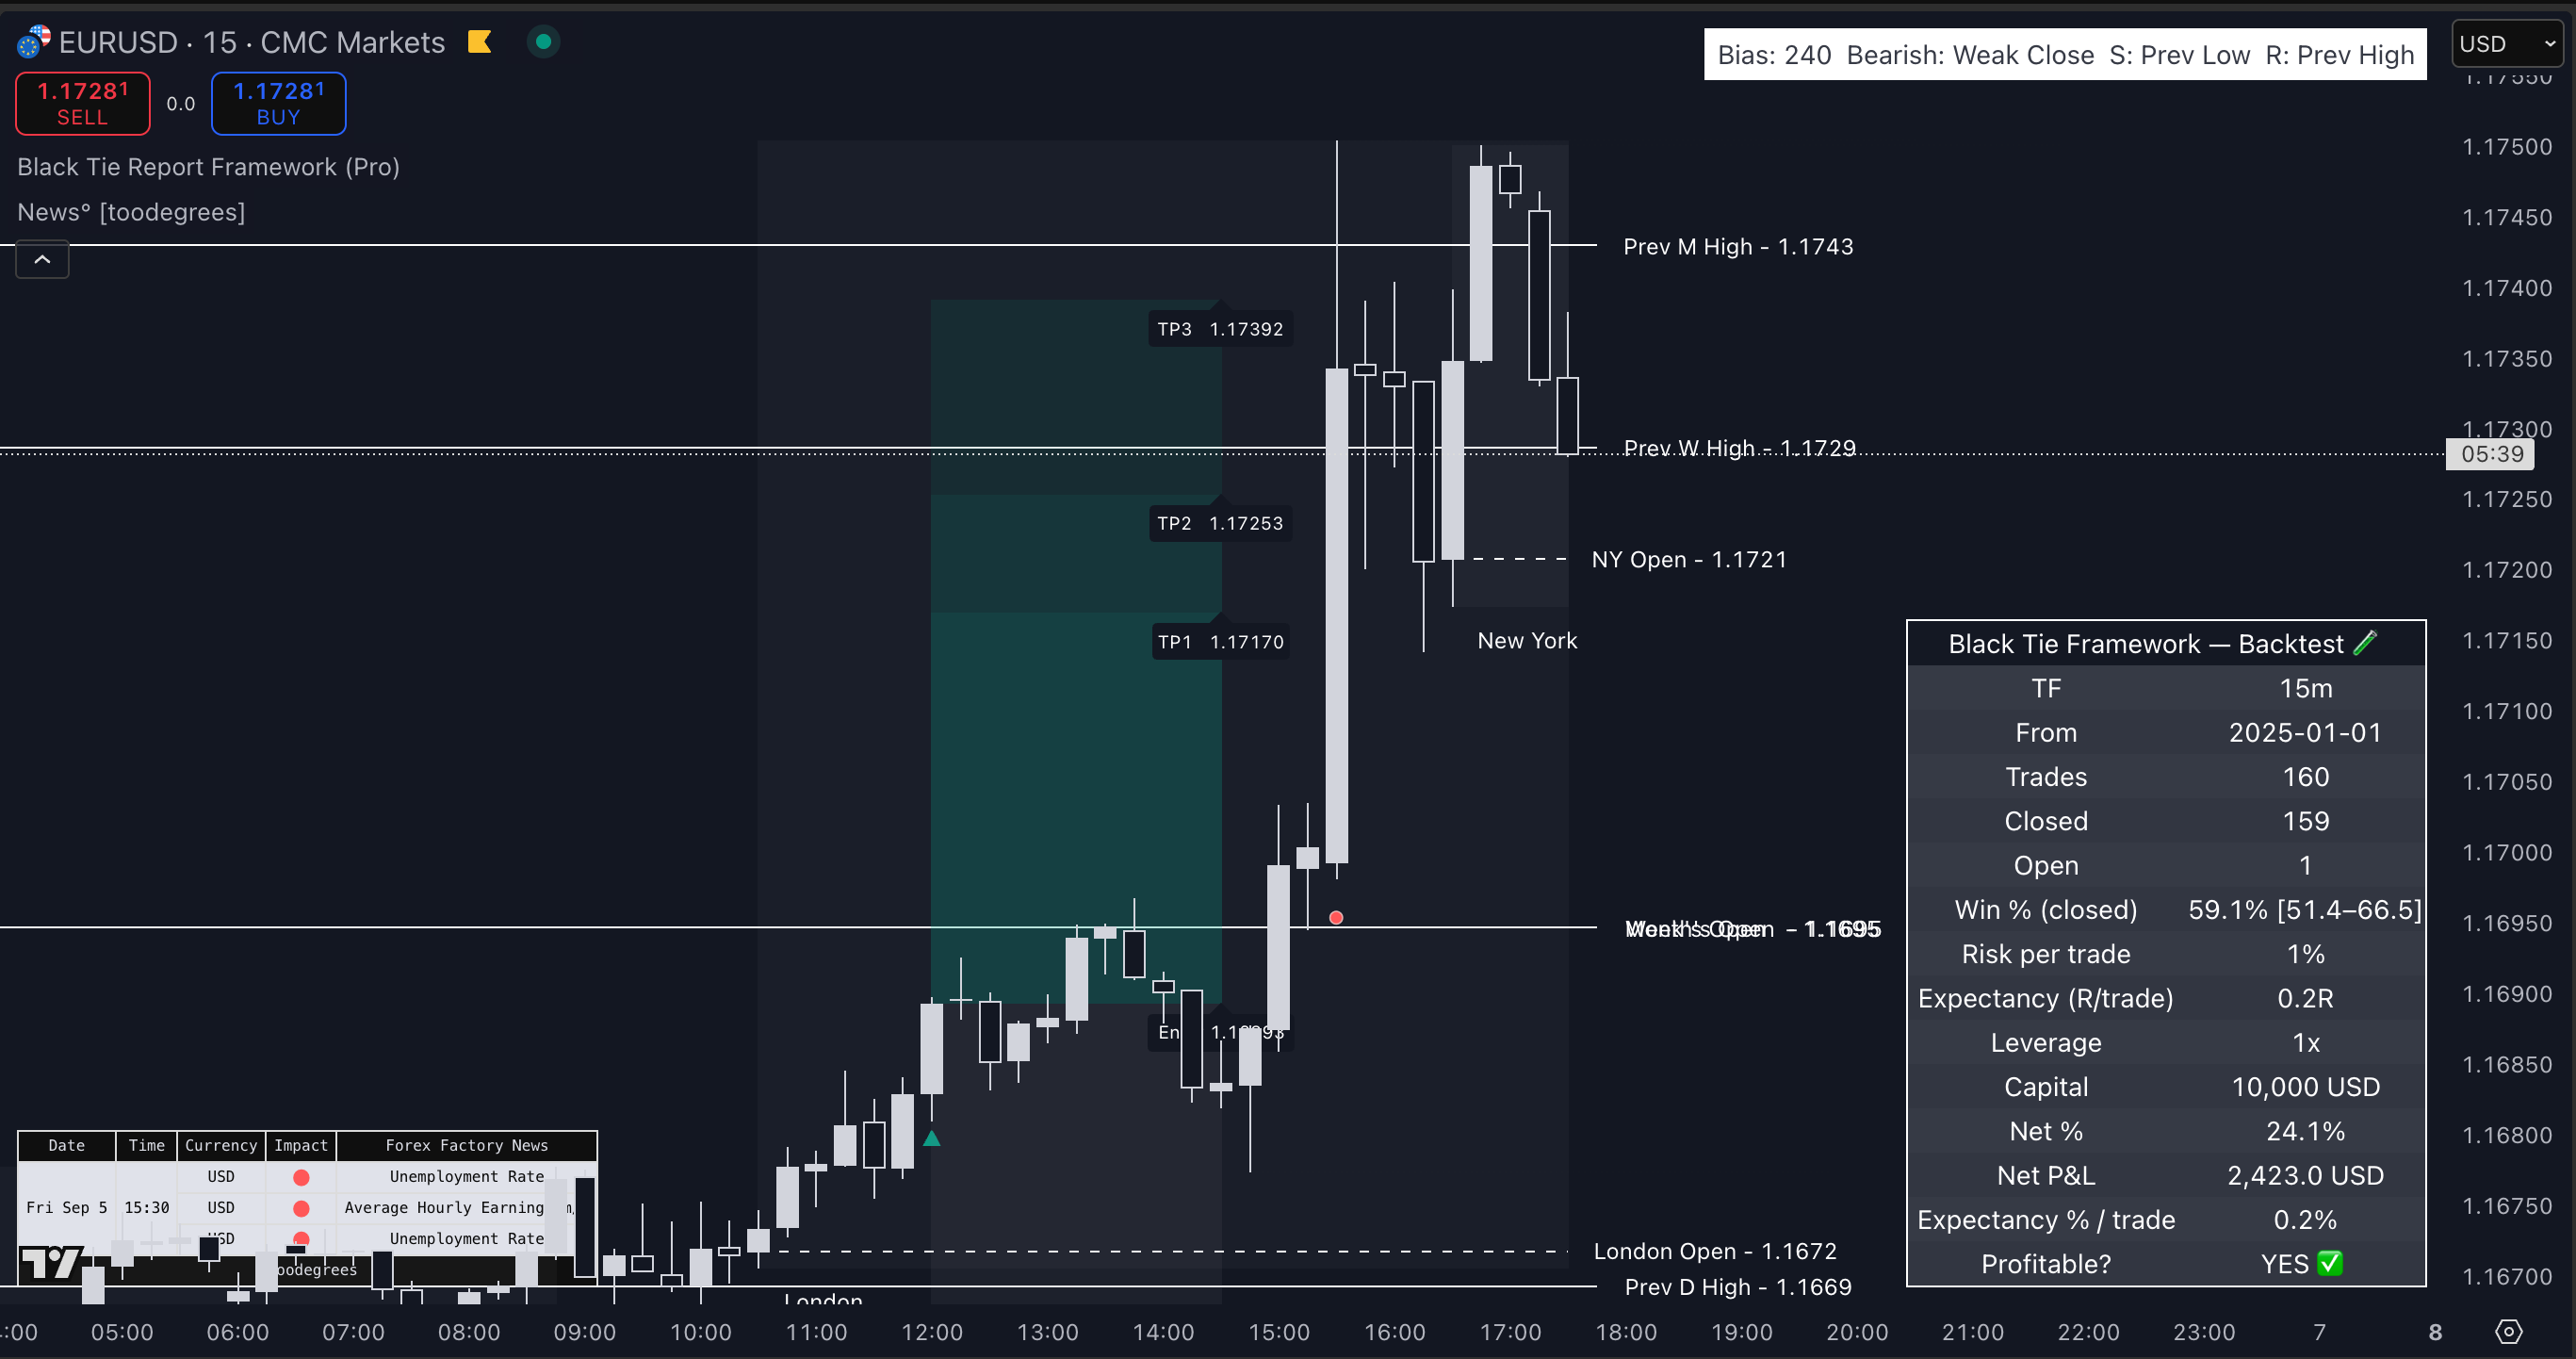
Entry: Break of structure and continuation above previous week’s high
Session: New York open (post-London consolidation)
Despite the news volatility, the Framework identified a valid long setup after a clean structure break to the upside.
Entry: 1.1713
TP1, TP2, TP3: Hit in succession by 16:00 UTC
News Impact: Favorable to EUR given weak USD data
Backtest Module Data (15m):
160 trades since Jan 1
Win %: 59.1%
Net return: +24.1% (spot, no leverage is applied on the calculation)
Expectancy: +0.2R/trade
Risk per trade: 1%
Net P&L (10k): $2,423
This trade followed the textbook sequence of:
Structure confirmation post-news
Liquidity sweep of London low
Clean continuation through NY Open
NAS100 – Clean Breakdown After Early Fake Rally
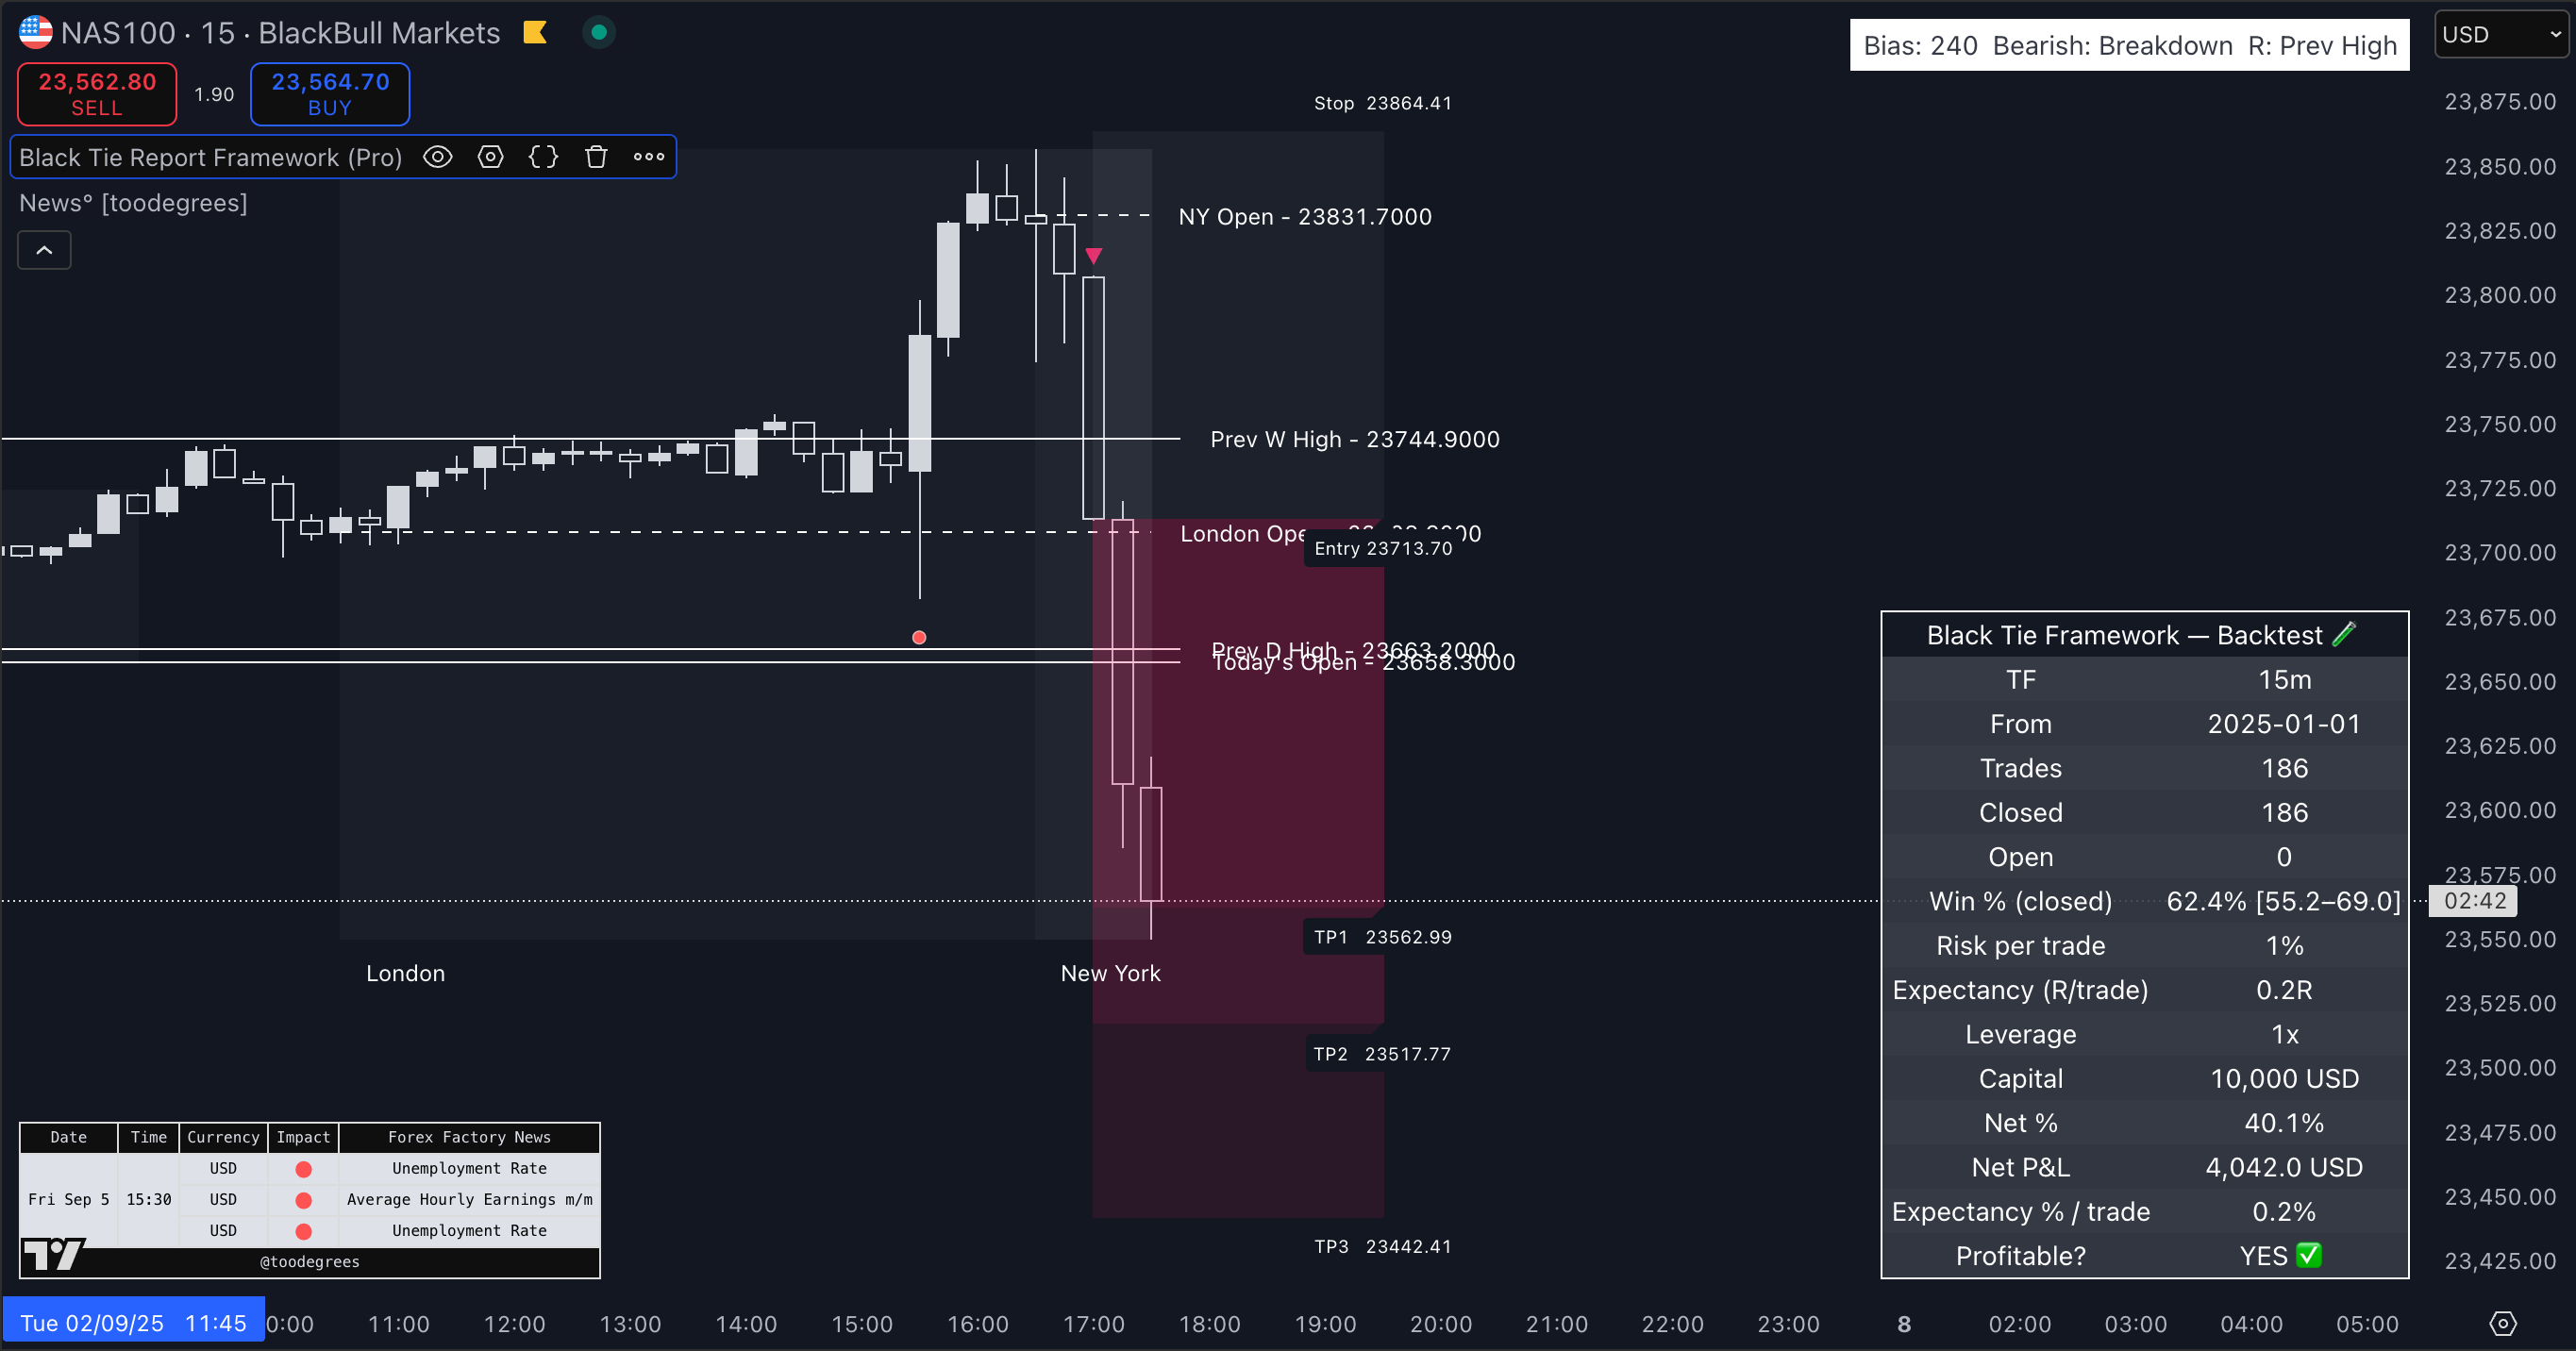
Entry: Rejection of previous week high and NY Open
Session: New York, post-news impulse
The Framework printed a short setup after price failed to hold the London support zone. The entry occurred at 23,713.70, with a stop above the rejection wick, and all 3 TPs hit with precision.
Entry: Short at NY Open rejection
TP3: Cleared 23,442.41 within 45 minutes
Risk: 1%
Volatility: Smooth breakdown without chop
Backtest Module Data (15m):
186 trades since Jan 1
Win %: 62.4%
Net return: +40.1% (no leverage)
Expectancy: +0.2R/trade
Net P&L (10k): $4,042
This setup was a model example of:
NY reversal following early fake rally
Structure + session confluence
Volume acceleration confirming the move
USDCHF – Double Setup, Double Win
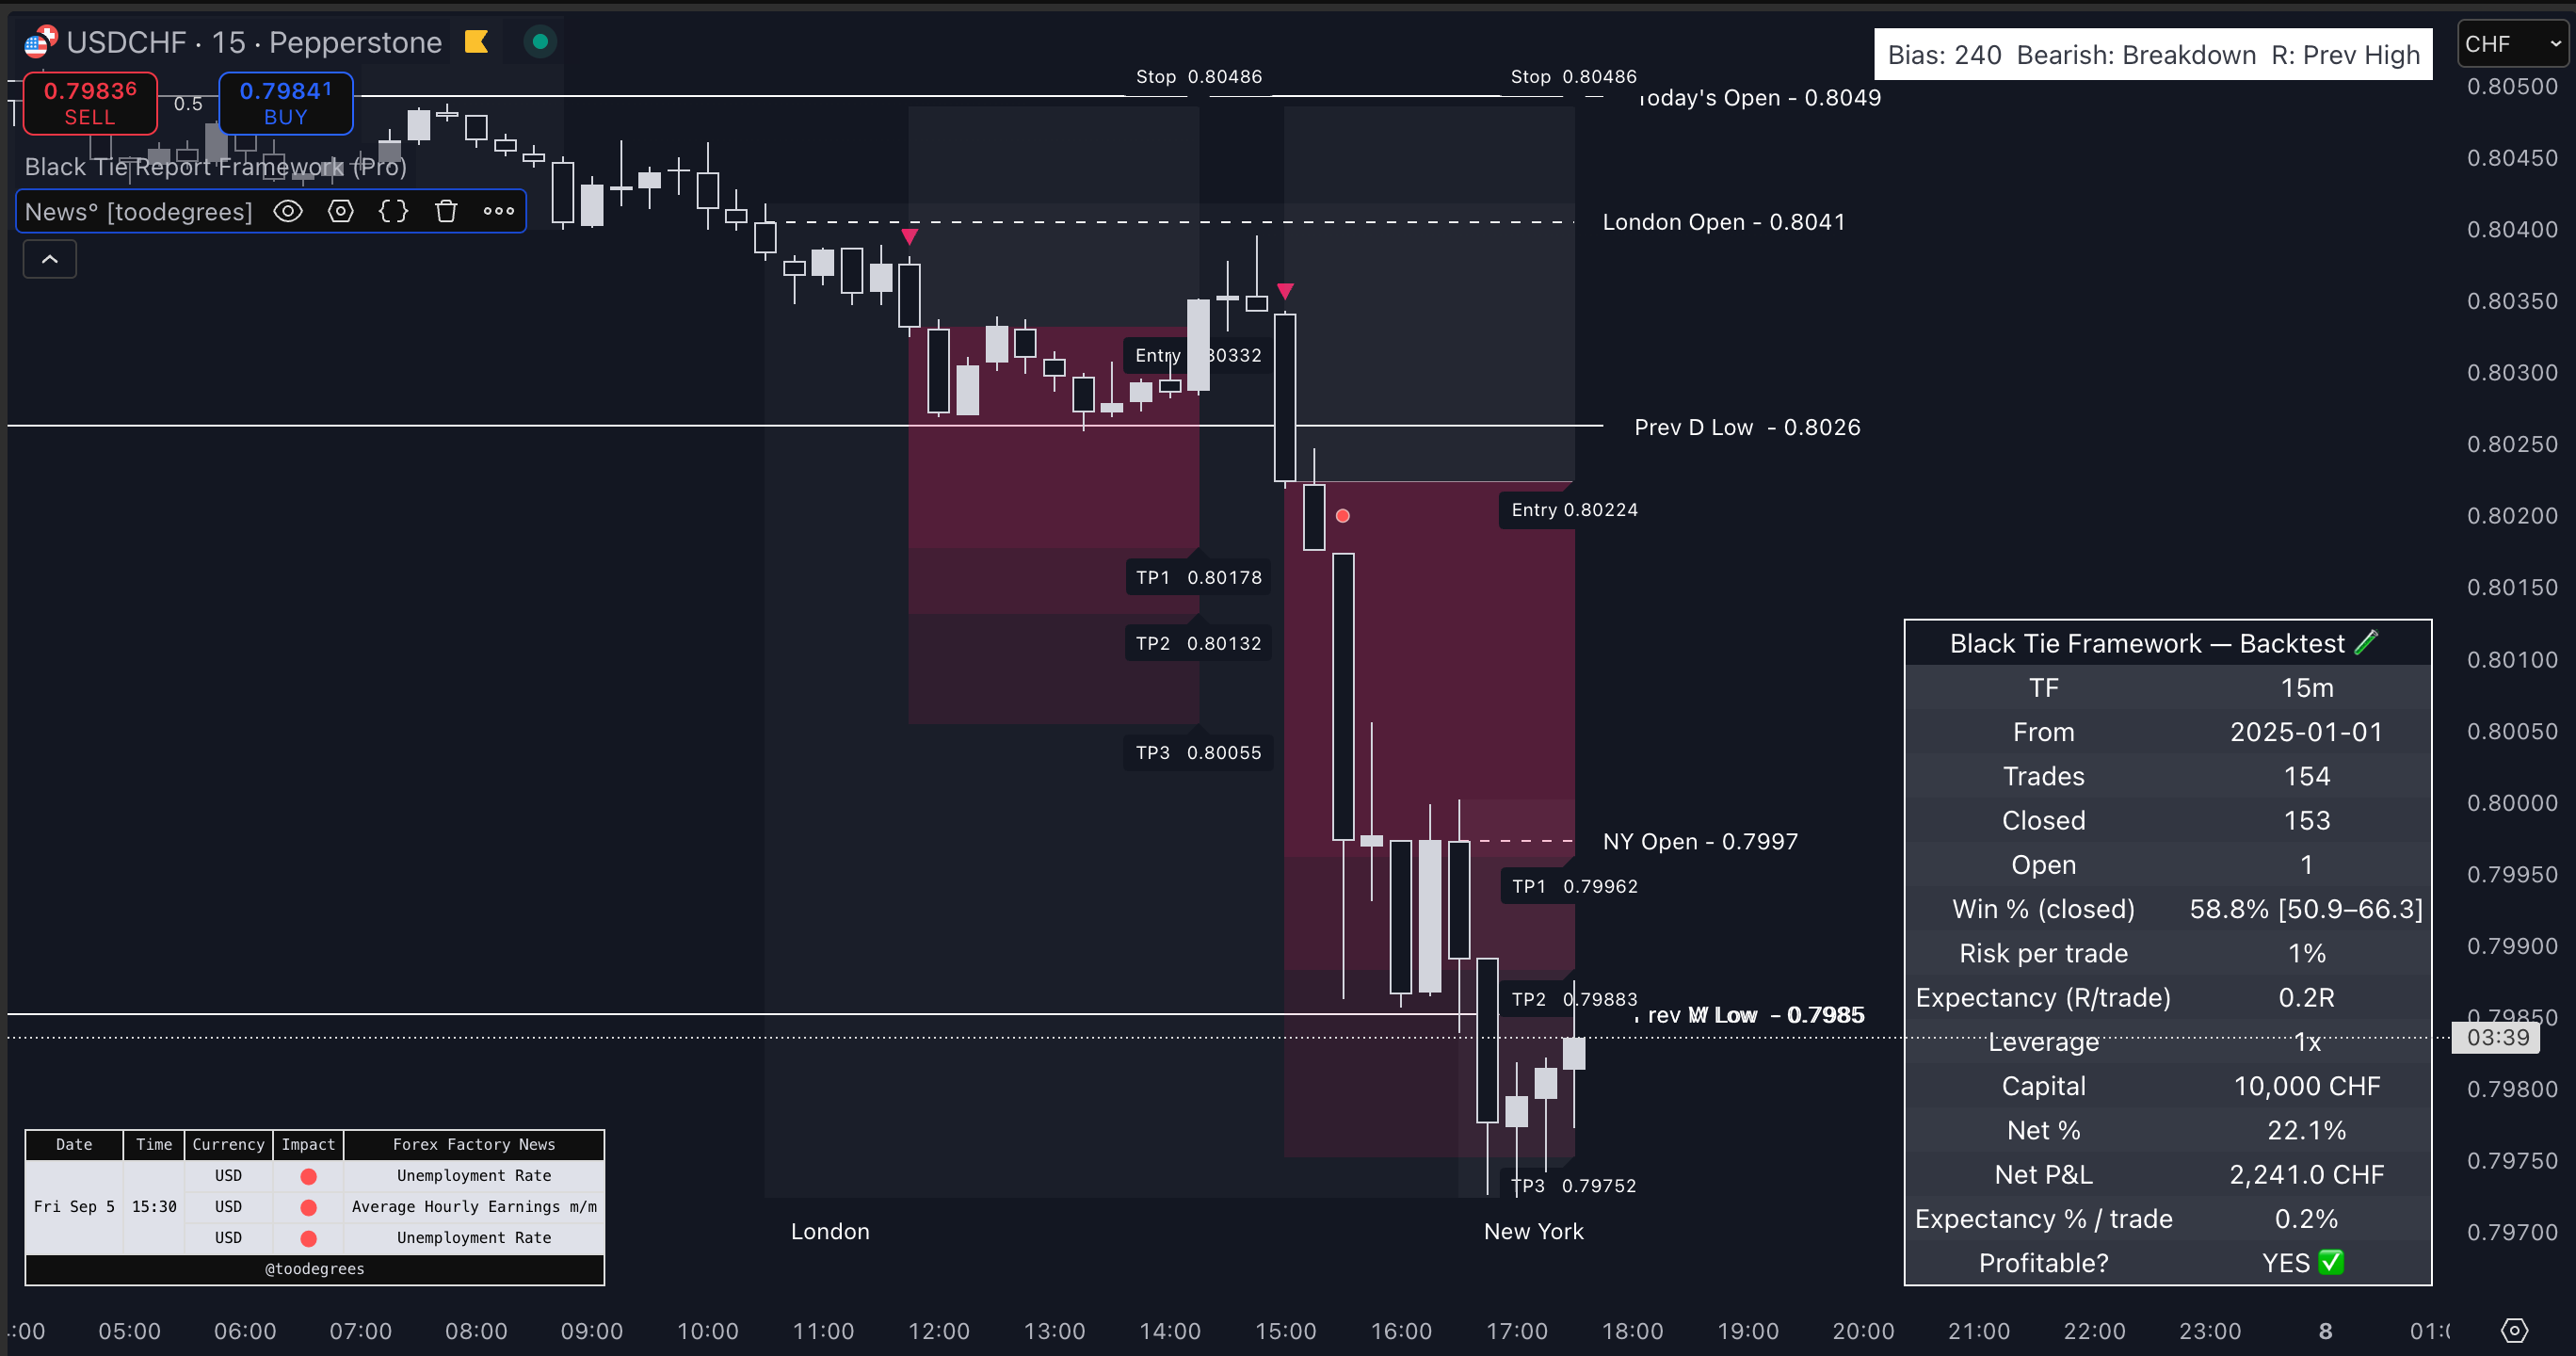
Session: New York
Conditions: Clear rejection at London open + weak USD data
The Framework triggered two consecutive short trades:
First entry: 0.80332 (failed continuation)
Second entry: 0.80224 (post-news breakdown)
Both hit all 3 TPs. These trades occurred after liquidity grabs around the daily low and validated the session filter logic.
Backtest Module Data (15m):
154 trades
Win %: 58.8%
Net Return: +22.1% (spot)
Expectancy: +0.2R/trade
Net P&L: $2,241
GBPUSD – Failed Breakout, Reversal to TP3
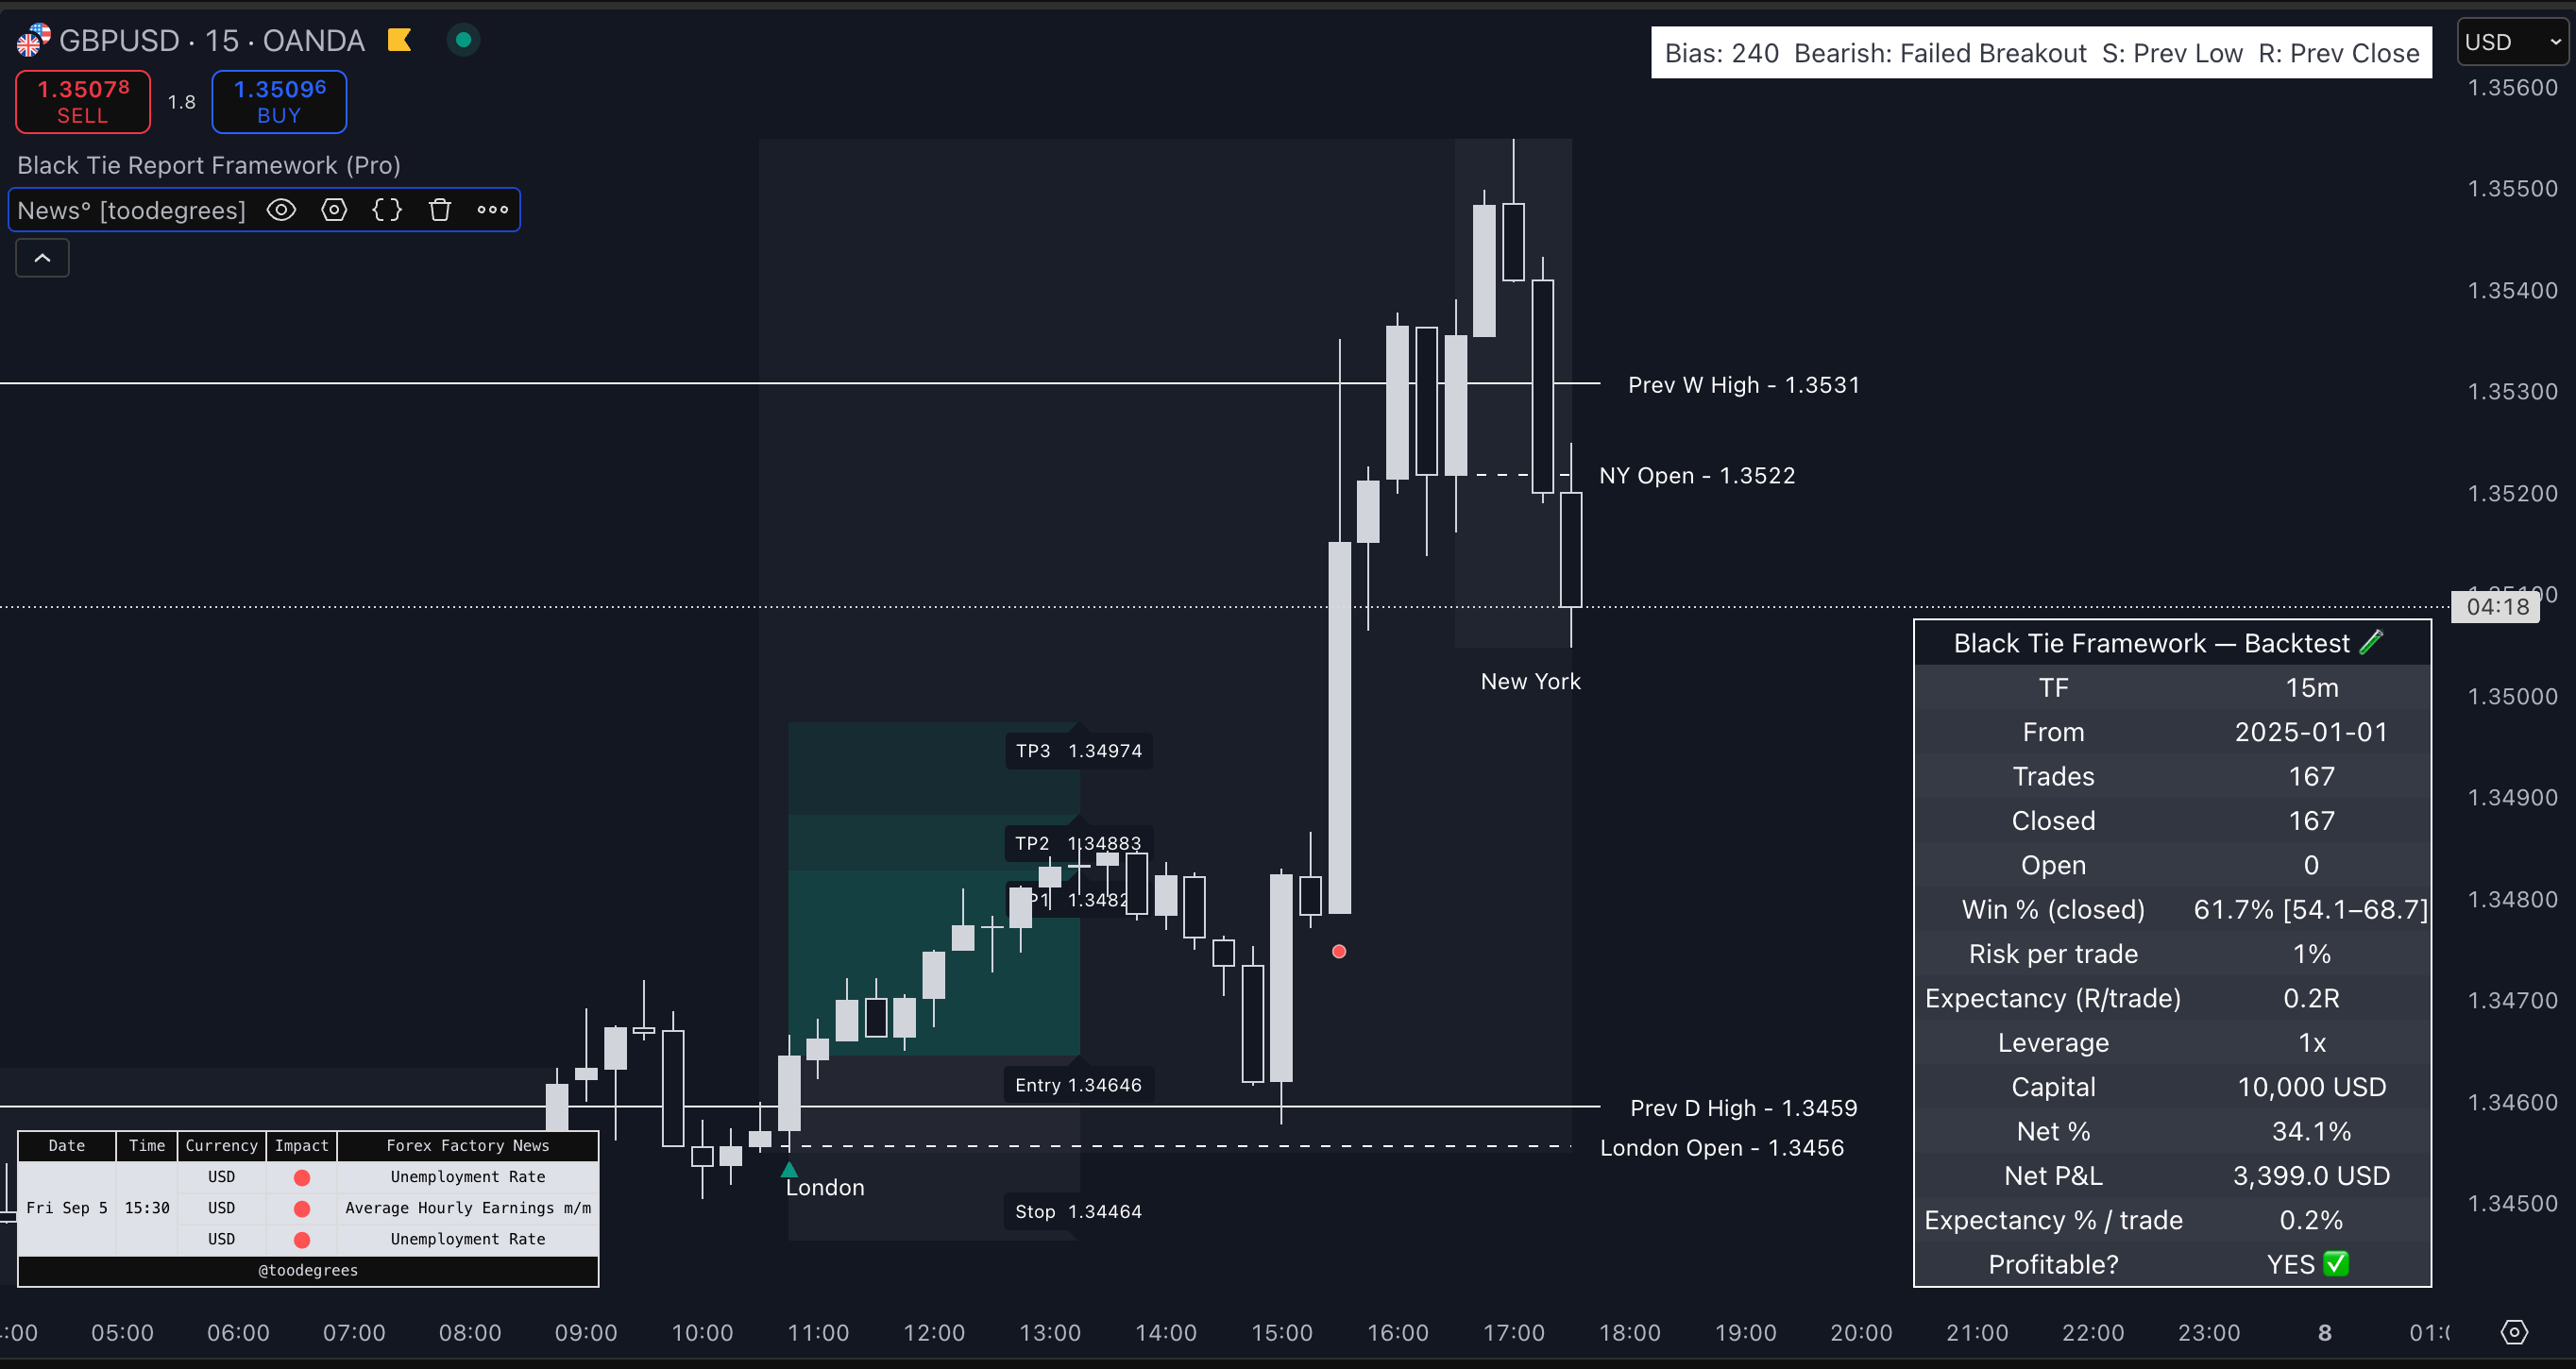
Entry: 1.34646
Conditions: Rejection at London high + weak USD confirmation
This trade was unique because it looked like a fakeout at first — but price respected the high, showed a strong 15m close rejection, and the Framework printed the short.
Stop: 1.34464
TP3: 1.34974
Execution: Clean impulse after NY Open
Backtest Module Data (15m):
167 trades
Win %: 61.7%
Net Return: +34.1% (spot, no leverage)
Net P&L: $3,399
What This Means: Structure > News
All trades shown above were printed after the news spike, once structure was confirmed.
There was no need to predict the news — the Framework waited for confirmation, order flow alignment, and key level rejection.
It’s the combination of:
Session timing (London, NY)
Price structure (Breakouts, Failed Breakouts, Liquidity sweeps)
SL/TP zones based on impulse size
That creates this level of accuracy.
About the Backtests
All screenshots include real historical trades taken by the strategy, with the following default parameters:
Account size: $10,000 (or equivalent)
Risk: 1% per trade
Leverage: None (1x only)
To adjust these to your capital:
$1,000 with 10x leverage = same as $10,000 at 1x
If you use 2% risk and 5x leverage → multiply P&L by 10
The system doesn’t rely on leverage, but adapts to it.
Save Time, Save Money, Trade Better
Let’s assume you spend 2 hours per day analyzing charts manually:
That’s 10 hours/week
40+ hours/month
At just $10/hour, that’s $400/month of your time
Now imagine that instead:
You set 1 indicator on your chart
You receive alerts with fully structured trades
You get SL/TP levels, backtest stats, session filters
All you do is review and execute
Black Tie Framework costs $47/month.
You save:
30+ hours/month
Mental energy
Cognitive mistakes
And gain:
Discipline
Clarity
Real data
Final Words
NFP is usually chaos. This time, it was clarity.
If you want to trade less, stress less, and earn more with structure — join the traders using Black Tie Framework every day.