
Gold Still Leads, Bitcoin Breaks Down
A closer look at the current market structure for XAUUSD and BTCUSD using the Black Tie Report Framework.

Market Overview
The start of this week brought two very different stories across major assets.
While Gold (XAUUSD) continues to climb steadily, supported by structural higher lows and risk-off flows, Bitcoin (BTCUSD) has entered a clear corrective phase after failing to hold above its key opens.
Both assets, however, are perfect examples of how structure tells the truth long before headlines do. The Framework plotted the shifts early — showing strength in Gold while flagging weakness in Bitcoin — allowing traders to prepare rather than react.
Let’s break down both charts in detail.
🔹 XAUUSD — 1H Analysis
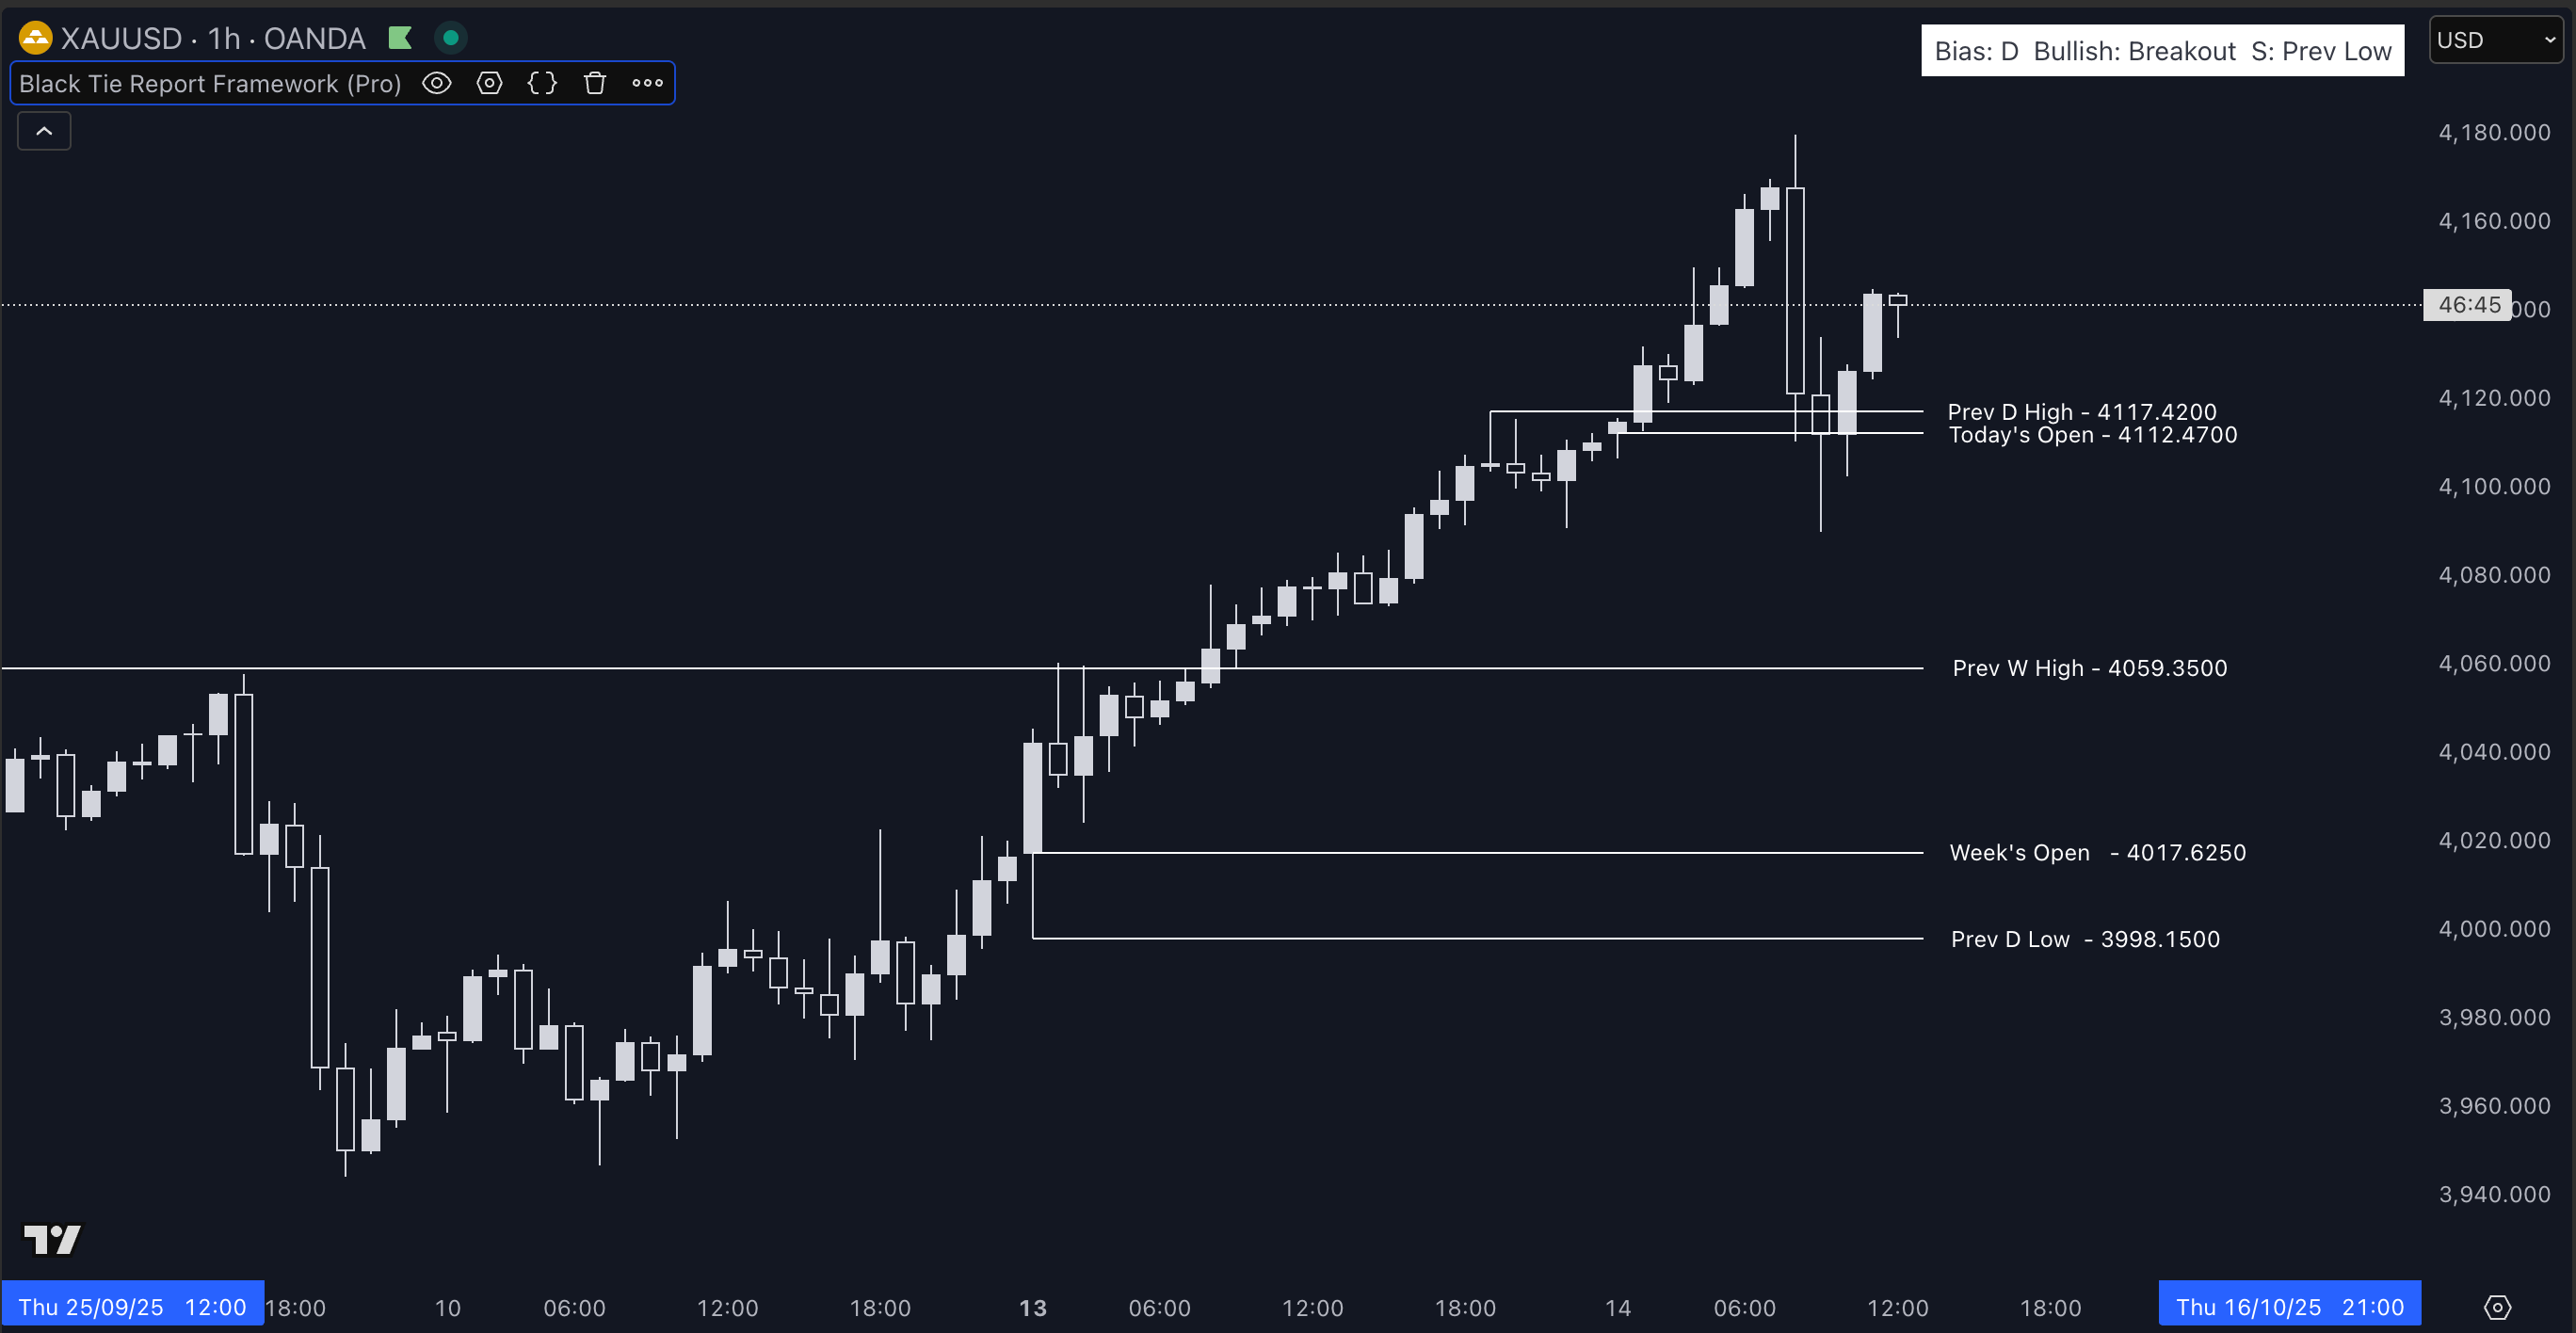
Gold remains bullish, maintaining a strong uptrend structure supported by higher highs and higher lows across multiple sessions.
Market Structure
Price continues to respect the bullish structure formed after the breakout above the Previous Week’s High (4059.35) and Week’s Open (4017.62).
Each retracement since then has been corrective rather than impulsive, showing no structural break to the downside.
The recent pullback into the Prev Day High (4117.42) and Today’s Open (4112.47) acted as a liquidity sweep followed by a strong rebound — a classic sign of bullish continuation.
Key Levels
Support Zones
4112–4117: Confluence between Prev Day High and Today’s Open. This is the most immediate intraday support and must hold for continuation.
4059.35 (Prev Week High): If price retraces deeper, this is the first major structural level to defend.
4017.62 (Week’s Open): Critical macro support. A close below would be the first technical sign of potential bearish momentum.
Resistance Zones
4170–4180: The current local high area. A clean break and close above this range opens room for further upside continuation toward the 4200 psychological level.
Bias and Confirmation
The Framework bias (Daily) remains Bullish: Breakout, signaling that both HTF and LTF structure are still aligned to the upside.
Until we see a daily close below 4059, there’s no structural reason to switch to a bearish bias.
For a confirmed bearish shift, we would need:
Break below 4059
Retest rejection
Failure to reclaim 4112–4117 zone
Only then would the Framework likely print a Bearish: Breakdown bias.
Summary
Gold remains technically strong. The recent dip into prior highs was a liquidity grab before continuation. Unless we see a decisive breakdown below 4059, the trend remains up — with 4180+ as the next area of interest.
₿ BTCUSD — 1H Analysis
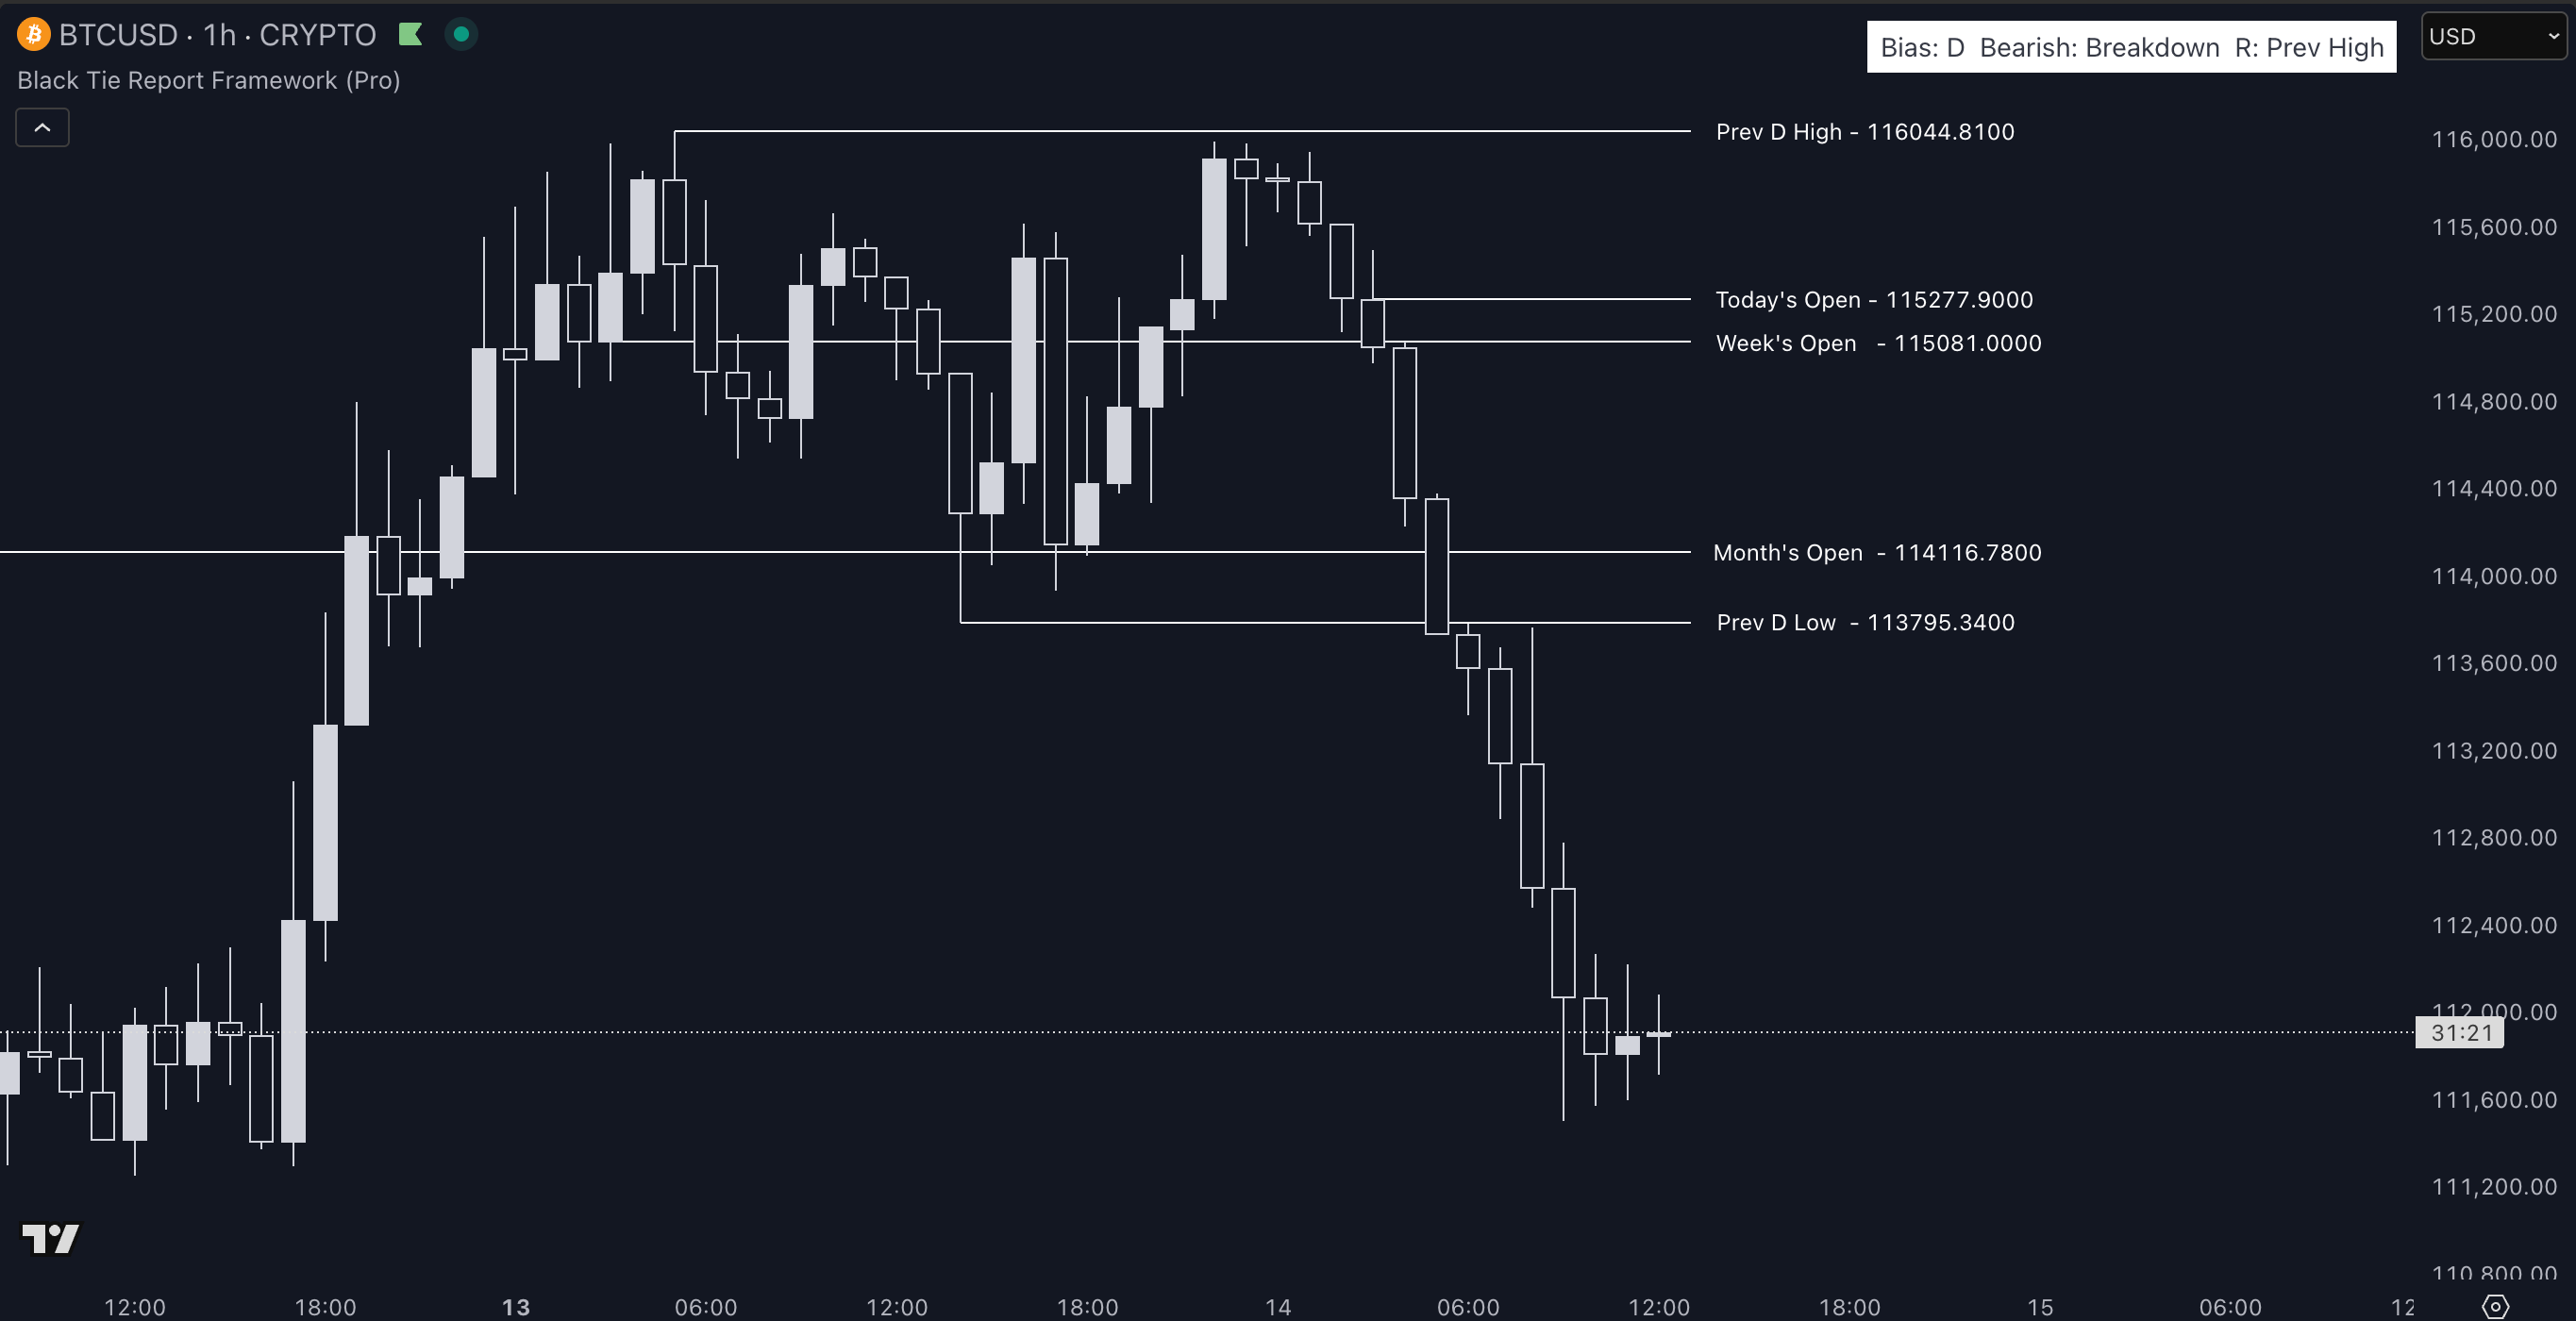
Bitcoin continues to show bearish structure, with clear momentum to the downside after rejecting from the 116,000 zone and breaking multiple key opens.
Market Structure
Price confirmed a Bearish Breakdown once it failed to hold above the Week’s Open (115,081) and Today’s Open (115,277) — both now acting as resistance.
The sharp rejection from the Prev Day High (116,044) triggered a full shift in structure, with successive lower highs and lower lows.
Momentum accelerated once price closed below the Month’s Open (114,116.7), which now serves as the mid-term pivot between continuation and potential recovery.
Key Levels
Resistance Zones
115,277 – 115,081: Overlapping Today’s Open and Week’s Open. This is the short-term control area — any retest and rejection here would likely confirm continuation lower.
116,044 (Prev Day High): Major swing rejection zone. If price reclaims and closes above this, bearish momentum weakens.
Support Zones
113,795 (Prev Day Low): Immediate intraday support. A clean break and close below it would open the path toward 112,000 and potentially 111,200.
Month’s Open (114,116): Pivotal structure level. Bulls need to reclaim and hold above it to neutralize the current bias.
Bias and Confirmation
The Framework Bias (Daily) is Bearish: Breakdown, confirming that both higher and lower timeframe structures are aligned to the downside.
Until BTC can reclaim and close above 115,277, the outlook remains bearish.
A shift back to Bullish: Failed Breakdown would require:
Reclaim above 115,277
Consolidation above the Week’s Open
Higher low structure on lower timeframes
Without those elements, every bounce is likely corrective.
Summary
BTC remains in distribution mode, printing lower highs and failing to recover above prior opens. The next decisive area sits at 113,795 — losing it would likely extend the drop toward 112k–111k. Reclaiming 115,277 is the first sign of strength worth watching.
⚙️ Framework Context
Every level on these charts — from the Prev Day High to the Month’s Open — is automatically plotted by the Black Tie Framework, including bias detection and session tracking.
You don’t need to draw or guess.
You just set your alerts and wait for the system to highlight high-probability setups.
Try it free for 7 days → blacktiereport.com